|
OC4270 Data Tutorials |
|
The following labs were developed to serve as a self-paced, laboratory tutorial for basic data visualization and analysis using the MatLab technical computing environment. Each of the Lab directories contain the sample data used to generate each figure shown, and each question builds on previous processing techniques, leading to more advanced techniques by the end of the labs.
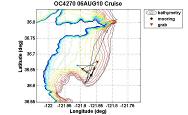
Lab 1: Bathymetry and GPS position data The goal of this lab is to familiarize you with using position and bathymetry data (2-D and 3-D) in MatLab, and to get a feel for working with "real" data that will be similar (if not identical) to the cruise.
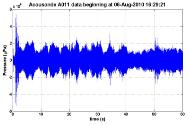
Lab2A: Acousonde Data files & formatting The goal of Lab 2 is to become familiar with the binary data files that contain the acoustic pressure data from the hydrophone sensors deployed (sonobuoy or Acousonde): loading, plotting and listening in the MatLab environment.
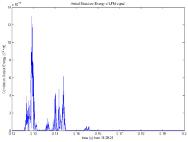
Lab3: Basic time-series analysis (filtering, correlation) The goal of this lab is to provide some basic analysis tools that can be used to process acoustic data time series: filtering, power & energy calculations, receive levels of CW signals, and correlation processing.
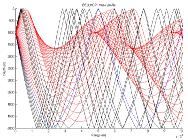
Lab 4: Simple acoustic models (ray tracing & parabolic equation) The purpose of Lab 4 is to familiarize the students with the implementation of two commonly used propagation models that predict the acoustic pressure fields in ocean environments: Bellhop and the Navy Standard Parabolic Equation (NSPE) model. |

|
Rev. 7/27/11 |