|
Lab 1: Bathymetry and position data |
|
The goal of this lab is to familiarize you with using position and bathymetry data (2-D and 3-D) in MatLab, and to get a feel for working with "real" data that will be similar (if not identical) to that collected during the cruise.
The functions necessary to complete this assignment are: DEG2KM converts degrees of arc to kilometers of distance on a circle VIEW changes to viewing aspect of a 3-D plot (azimuth/elevation angles)
UDASREAD Custom function to extract ship's Underway Data Acquisition System (UDAS) position & information SEABIRDREAD_AUG10 Custom function to extract CTD cast data from Aug2010 Microcat data |


|
Project questions:
|
|
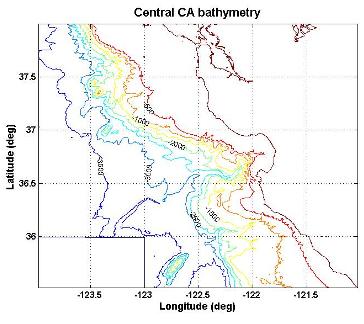
1) Generate a 2-D contour plot of the Central California bathymetry MatLab functions: load, contour, clabel, xlabel, ylabel, title Required data files: ccal250.mat (bathymetry data) |
|
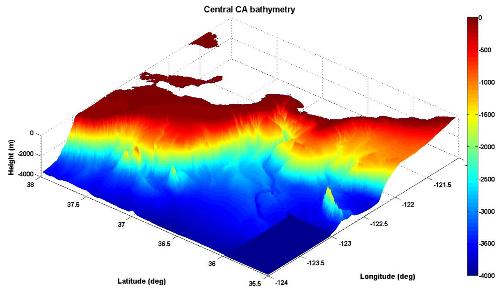
2) Plot a 3-D mesh surface of the Central California bathymetry, MatLab functions: load, mesh, view, xlabel, ylabel, title, colorbar Required data files: ccal250.mat (bathymetry data)
|
|
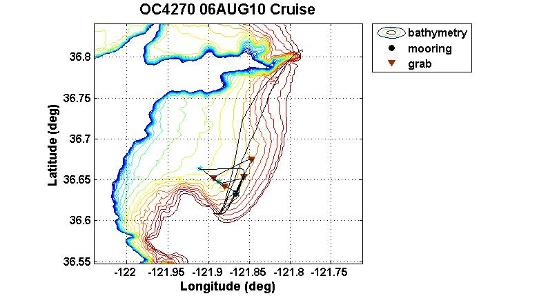
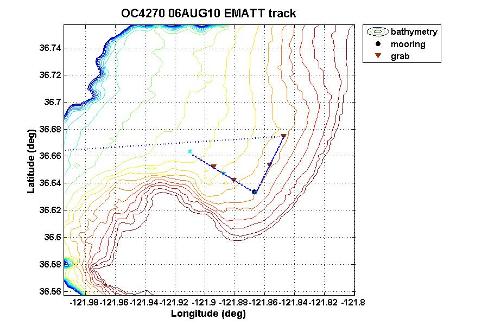
3) Plot the ship track (see udasread.m), EMATT track, AcousondeTM mooring and CTD / sediment grab positions (manually pull from cruise log) for the provided experiment data, including the bathymetry contours (every 10m). Label axes and provide a legend to identify the ship & EMATT track line(s), CTD & grab locations.
Custom functions (provided): udasread.m, EMATT_track.m MatLab functions: contour, hold, plot, legend, axis, udasread Mapping toolbox functions: distance, almanac Lab data files : OC4270_080610.LOG (cruise log text), jhmudas_201086.txt (ship track), ccal250.mat (bathymetry), DelMonte_RPS1.csv (EMATT geometry data)
|
|
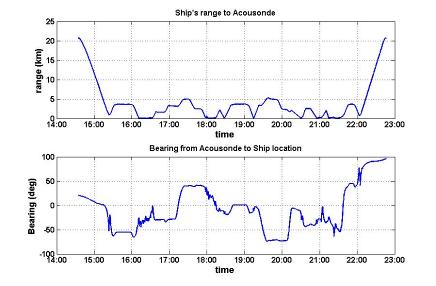
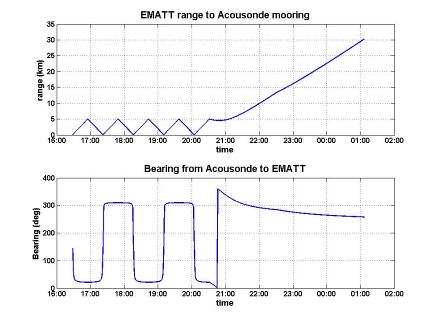
4) Generate range & bearing time series between the AcousondeTM mooring location (from log) and the projected EMATT position, and plot (see EMATT_track.m if you need an example). Repeat using these same functions for the ship position data extracted above.
Custom functions (provided): udasread.m, EMATT_track.m MatLab functions: plot, axis, interp1, xlabel, ylabel, title Mapping toolbox functions: distance, almanac Lab data files : OC4270_080610.LOG (cruise log text), jhmudas_201086.txt (ship track), DelMonte_RPS1.csv (EMATT geometry data)
Example for distance usage (mapping toolbox needed): [rng,az]=distance(lat1,lon1,lat2,lon2,almanac('Earth','wgs84')); |
|
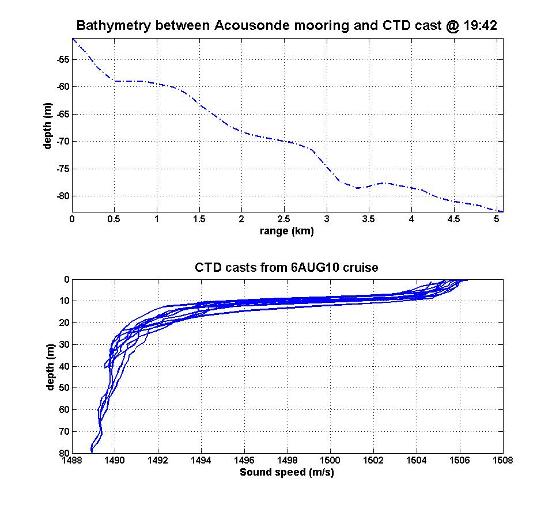
5) Environmental data for model inputs. Extract the bathymetry between the AcousondeTM mooring location and the 80m CTD cast taken at 19:42 (36° 39.808' N, 121° 54.588' W).
Plot depth (m) vs. range (km) along this track as a 2-D plot.
Plot sound velocity profiles from CTD casts contained from the cruise data.
Custom functions (provided): seabirdread_Aug10.m MatLab functions (Mapping Toolbox): gcwaypts, interp2, distance, almanac Required data files: OC4270_Aug10.asc, ccal250.mat (bathymetry data)
NOTE: CTD casts end before the bottom depth (for equipment safety). For many ocean models, this data is the only defining element for the water column, and therefore information must be extrapolated down to the bottom depth or the model will see the disparity between the bottom of the ocean and the bathymetry.
|
|
Rev. 7/27/11 |