Many early ocean models had a quiescent, or inactive bottom layer, and didn't use bathymetry at all. Now most ocean circulation models do include bathymetry, although some models that we will discuss - notably the upper ocean models like TOPS do not use bathymetry.
Why Bathymetry?
- Some currents in the ocean are influenced by topography
(topographic steering: Coriolis parameter / Depth = constant )
- Friction dampens flow
bottom
coast
How is it defined?
Ocean models use metric units for depth - either meters or kilometers;
however, the Navy also commonly uses feet and fathoms.
 To become familiar with converting meters to feet and fathoms and vice versa,
use the
units conversion calculator, and
enter your answers in the blank spaces below.
To become familiar with converting meters to feet and fathoms and vice versa,
use the
units conversion calculator, and
enter your answers in the blank spaces below.
Where does the data come from?
- Long rope (ancient times - near shore)
- Echo sounders
from shipboard measurements
took a long time to acquire data for large areas,
since only the depth below the ship's track was known.
Multibeam arrays produce swaths of soundings along the ship's path.
Modern systems can map swaths with widths up to several times the water depth.
- Satellite altimetry
Satellites that can measure the distance to the earth's surface are used
to map the earth's topography.
The ocean's surface takes on the shape of the
landforms beneath it.
This is because variations in mass cause variations in
the gravitational attraction of the water, causing bumps in the ocean surface.
For example, a seamount would have a higher mass, and cause additional water to
mound up above it.
The differences in sea level can be 10's of centimeters to 10's of meters.
While these techniques have resulted in a more complete picture of the
earth's geoid, the resulting bathymetry may not be spatially dense enough for
some finer-scale regional models.
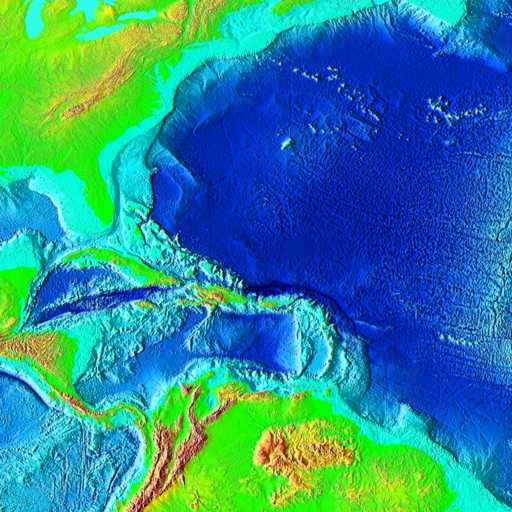 Sample 2 minute bathymetry from NOAA. (Opens in new window) Sample 2 minute bathymetry from NOAA. (Opens in new window)
For more information, go to
http://topex.ucsd.edu/marine_topo_mar_topo.html
|
Image courtesy of NOAA |
What are the databases called?
- Echo Sounder maps - digitized
- Digital Bathymetric Data Base 5 minute (DBDB5)
This bathymetry database was assembled
by the US Naval Oceanographic Office in the early 1980's from computer
interpolation of existing contour maps of ocean basins.
- Digital Bathymetric Data Base - Variable (DBDB-V)
DBDB-V is similar to the DBDB5, but has finer resolution in many coastal regions. For
example, if you examine the map of coverage below, you'll see that
along the east coast of the U.S., there is 0.5-minute resolution.
In this short exercise, you'll see the difference the high resolution coverage can make
in capturing important bathymetric features.
- Click on the image of the DBDB-V coverage above.
A graphical interface for extracting the DBDB-V data (or images) from the
Naval Oceanographic Office will appear in a new window.
Click here if it's not working
- We want to zoom in to the area off the west coast of North America. To do this, click on the "Area" tab, and enter the following coordinates:
| Top: | N 38 | | Bottom: |
N 32 |
| Left: | W 126 | | Right: |
W 120 |
You should be able to see that the resolution of the data available for
this area is 1-minute, so enter "1" for the grid spacing.
Leave the coordinate system as "Equatorial".
Press the submit button.
- A popup window will appear with a list of output options. Choose "GMT
Contour Image (GIF)".
- Compare your image at 1-minute resolution with the image below of the
same region at 5-minute
resolution.
- ETOPO2:
Global 2' Elevation NOAA product - satellite & ship data
The seafloor data between latitudes 64oN and 72oS are from the
work of Smith and Sandwell (1997).
These data were derived from satellites
and Digital Bathymetric Data Base Variable Resolution (DBDB-V),
version 4.1, gridded at 5 minute spacing; some data in this region are
from the older DBDB5 (these data were also used in ETOPO5).
Seafloor data northward from 64oN are from the new International
Bathymetric Chart of the Arctic Ocean (IBCAO) Version 1.
Websites for ETOPO2 Data:
How do different models define/use it?
To incorporate bathymetric data in a model, the bathymetry must be matched to the model's grid. In very fine scale models, such as coastal or turbulence models, the known
bathymetry might need to be interpolated to the model gridpoints.
However, in the global and regional models we'll be discussing later, the known bathymetry is finer than
the model grid.
For these models, the bathymetry data may need to be smoothed before it is put
on the model grid.
If it is not smoothed in these cases, the model becomes unstable and produces
unrealistic numbers and will cease to run.
Some manual adjustment to the bathymetry may also be necessary before it
can be used in an ocean model.
Because of the numerical method used to solve the equations of motion (flow),
there is a requirement that there be two grid points at which density
is defined to determine the value of velocity between these two points.
This means, for example, a canyon must be at least two grid points wide.
As an example, compare the real bathymetry
with the bathymetry used in a 0.1omodel and a 0.25o
model for either the Gulf of Mexico or
southern Florida and Cuba.
When is bottom depth NOT a fixed quantity in a model?
In coastal problems involving sediment transport. When wave models get
coupled with coastal circulation and sediment transport models, this will
become an issue.
The Navy, and in particular, NAVO, spends considerable effort on obtaining accurate
bathymetry, including in data poor areas.
We have introduced the subject in only the most cursory fashion here, as NAVO offers
extensive training in hydrographic science through other channels.
The model's all set to go. But wait, an ocean at rest will remain at rest. So....
we need to give it a push. This is called "forcing" a model, the subject of the next session.
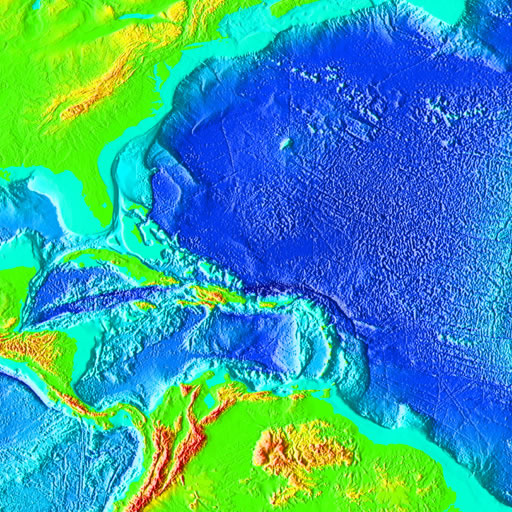 Sample 2 minute bathymetry from NOAA.