Air-sea temperature difference
In this module we will explore the factors that affect the humidity gradient near the surface. These factors are:
These four parameters allow the calculation of the evaporation duct profile using the bulk method.
Air-sea temperature difference |
|
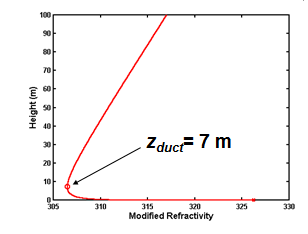
| Typical Unstable Conditions ΘT < 0
|
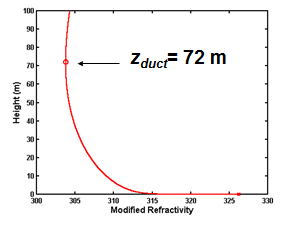
Typical Stable Conditions ΘT > 0
|
| In unstable conditions when the water surface is warmer than the air (left), Z* is relatively low and the M profile curves (changes gradient) rapidly near the surface. In stable conditions when the water surface is colder than the air (right), Z* is low and the M profile curves more slowly near the surface. | |
Humidity Effects |
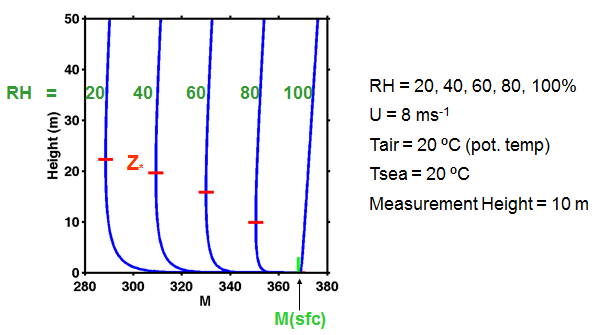
| In the figure below and subsequent figures, the blue lines represent M profiles for various conditions. The height of the duct, Z * is indicated by the horizontal red bar. The humidity at the surface is assumed to be 100%.
The figure shows how the evaporation duct changes with relative humidity. When conditions are very dry (left blue line, RH=20%) the evaporation duct is high and strong. As the air humidity get higher and closer to the surface value the fluxes will decrease and the evaporation duct gets lower and weaker until it disappears entirely if the air is at 100% humidity. This latter case usually indicated foggy conditions. The presence of fog near the surface indicates one of the few situations when the evaporation duct is not present. Operators may attribute the decreased ranges in foggy conditions to the fog droplets when in reality it is because there is no evaporation when it is foggy and hence no ducting. |
 |
Wind Speed Effects |
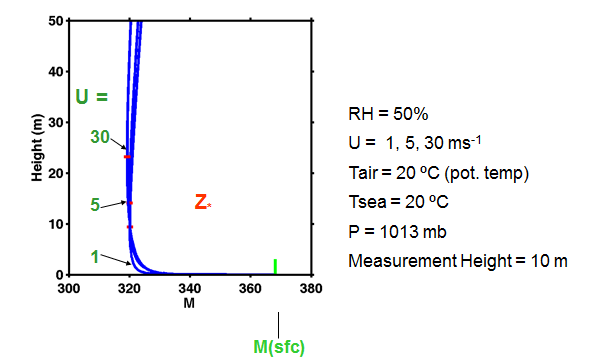
| Higher wind speed is associated with higher evaporation duct, as shown in the figure below, where the wind speed varies from 1 m/s to 30 m/s. |
 |
ΔT Effect |
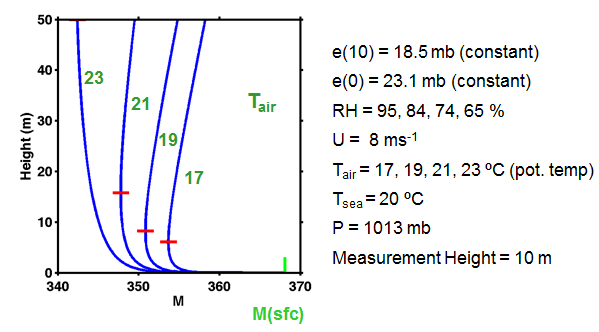
| The figure below shows the effects of air-sea temperature difference which is directly related to stability. So here we see how important stability effects are to the M profiles.
When the conditions are stable (Tair > Tsfc, left two blue lines) the evaporation duct is higher than for unstable (right two blue lines) cases. The Tair = 23 case has an evaporation duct higher than the 50 m top of the plot. These very stable cases are problematic because the high Z* values may be above the surface layer where the equations that derived these profiles are not valid. Evaporation duct characteristics are subject to large errors in very stable conditions. |
 |
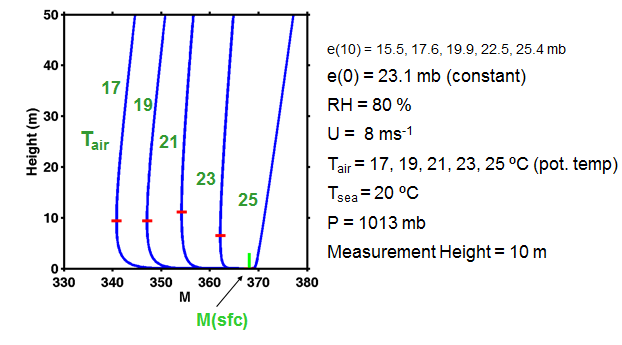
| Next we vary the temperature , but keep the relative humidity constant. Because the vapor pressure, e, depends on the relative humidity, RH, and the temperature (Tair) the changes in Z* due to changes in air temperature at constant RH are complicated. From Tair = 17-19 the stability effects are most important and Z* increases with more stable higher Tair conditions. But for Tair > 21, the increased vapor pressure becomes close to the surface value and hence the moisture flux and height and strength of the duct decrease and eventually disappear when the vapor pressure of the air becomes higher than the surface value. The stability effect is stronger for lower wind speeds. |
 |
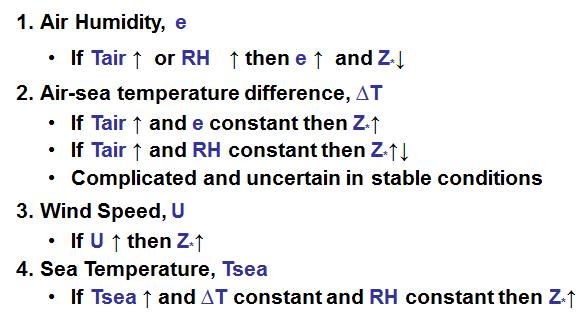
| Summary of Factors affecting the humidity (e) gradient near the surface and therefore Z*
All these plots presented here contain a huge amount of information and they represent only a few specific cases. An infinite number of situations are possible due to the different wind speed, temperature and humidity conditions that can exist. A student could not be expected to understand all the details in a short time. However, the major points are summarized below with the most important qualitative information about evaporation duct height variations. |
 |