In our last module, we will look at how the evaporation duct height depends on geographical location and time of year.
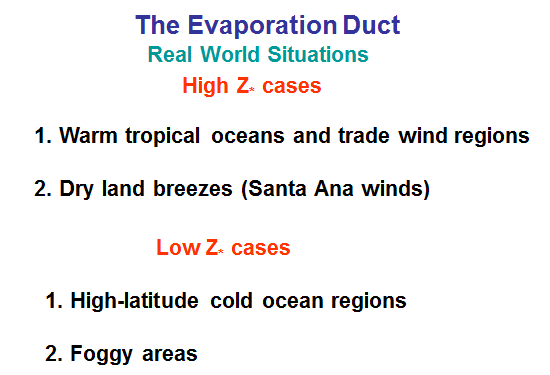
In general, the Evaporation Duct tends to extend higher in warm tropical oceans and trade wind regions, and areas where there are dry land breezes. Lower evaporation ducts occur in high latitude cold ocean regions and foggy areas.
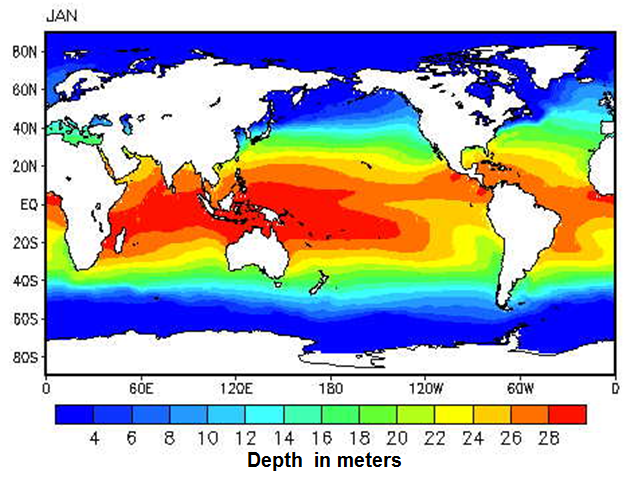
Below are averages of evaporation duct height for July and January:
 |
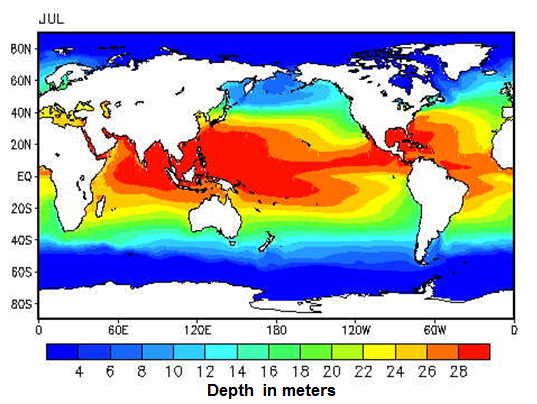 |
| The figures above look very similar, with higher evaporation duct heights in the tropics as expected and lower heights over cooler waters. In July, the higher ducts are shifted northward compared to January. | |
 |
| The chart above shows the percent occurrence of ducts of various heights (increasing on the x-axis) for various ocean regions. Warmer ocean regions such as the Mediterranean Sea and Eastern Caribbean have, on average, higher evaporation ducts than colder ocean areas such the Northeast North Atlantic and the Northern Pacific. |
| Examples of Seasonal Variation of Evaporation Duct Height | |
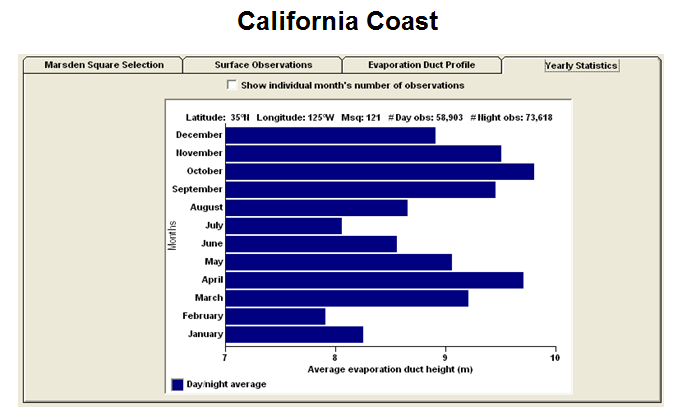 |
Climatology for the California coastal region. Note that the scale on the average evaporation duct height on this chart only varies by a couple of meters throughout the annual cycle, but the ducts tend to be lower in July due to the presence of fog, and higher in the fall when the weather is warmer and the ocean is also wrm. In January and February, the water tends to be cooler and so the evaporation duct height is lower. |
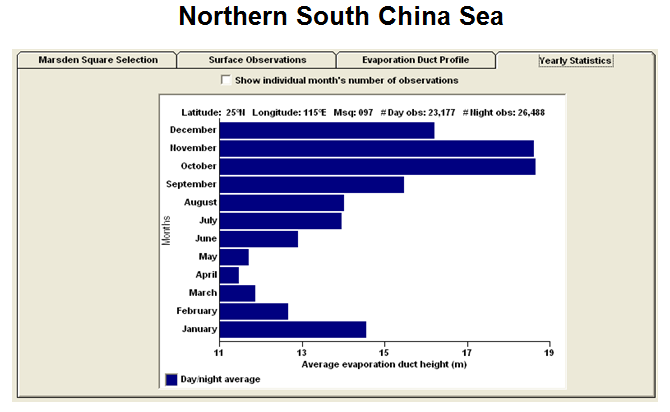 |
Climatology for the northern South China Sea. Note the different scale now for evaporation duct height. There is a more pronounced annual cycle with higher ducts in October and November and shallower ducts in the spring. This is due in part to the monsoon, which brings dry air off the Asian continent in the fall, and moist air in the spring. |
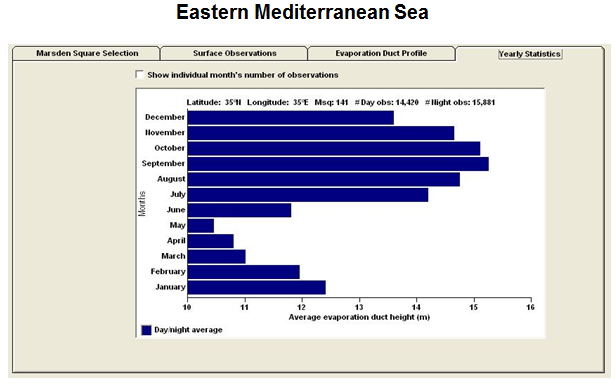 |
Climatology for the Eastern Mediterranean Sea. The pattern here is due to water temperatures, with warmer water in the late summer and fall, and colder temperatures in the spring. |