Ducting Formation Mechanisms
Learning Objectives
- Understand the meaning of subsidence, mixing, surface fluxes, horizontal advection and elevated temperature or humidity sources.
- Be able to describe using diagrams and words how each of the above phenomenon can caused ducting.
Introduction
Now that we have covered the basic principles we are ready to examine what atmospheric features lead to ducting and other non-standard propagation conditions.
Ducting Formation Mechanisms
Ducts are associated with temperature inversions (increase in temperature with height), and more importantly, sharp decreases in humidity with height. There are five situations that create these inversions:
- Subsidence
- Mixing
- Surface Fluxes
- Horizontal Advection (differential)
- Elevated Temperature or Humidity Sources or Sinks
Next we'll examine each of these mechanisms in more detail.
| Subsidence
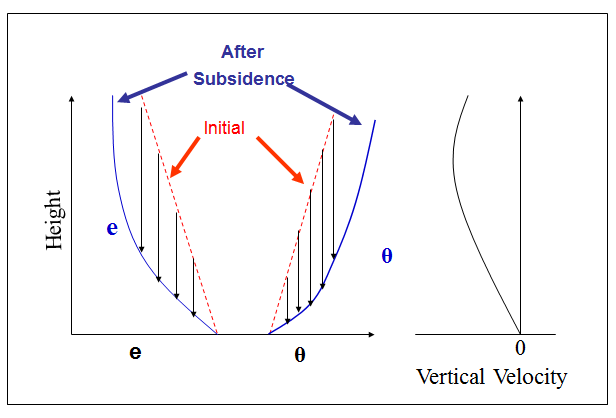
Background: Subsidence is simply the sinking of air in the atmosphere. When we discussed humidity variables we noted that specific humidity, q, is the only conserved humidity variable. This means air raised or lowered (i.e. subsidence) in the atmosphere with no sources or sinks of humidity will keep the same q. Vapor pressure, e, is the humidity variable that is directly related to humidity effects on the values of M and N. Although in a strict sense e is not conserved, for most situations in the lower atmosphere, e can also be considered to be a conserved variable and we will treat it as such here.
|
| This plot shows vapor pressure, e, and potential temperature, θ vs. height. Initial profiles of e and θ are indicated by the red dashed lines. Subsidence is sinking air as indicated by the vertical velocity plot on the right. Air cant go into the surface, so the air near the surface moves downward slower than the air higher up. The subsidence moves the parcels closer to the ground as shown by the black downward pointing arrows. The arrows go straight down because θ and (almost) e are conserved quantities. The lower air moves less downward distance as indicated by the length of the downward pointing black arrows. The resulting profiles of e and θ after subsidence are indicated in blue. Note that the lower parts of the profiles for e and θ now have steeper negative and positive gradients respectively.
|
 |
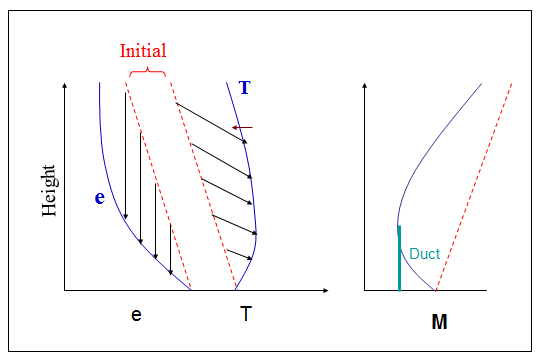
| This is the same situation as the previous plot but now temperature, T, is shown instead of potential temperature. The shape of any T profile is similar to a θ profile that has been tipped to the left. T is not conserved (it increases in descending air parcels). So whereas the initial θ profile on the previous slide had a positive vertical gradient (tipped to the right), the initial T profile (red dashed) has a negative gradient. After subsidence, the temperature curve takes on the shape of the blue curve. Notice that there is a temperature inversion in the lower part of the atmosphere as a result of the subsidence. The right plots indicates the value of the modified refractivity, M before (red dashed) and after (blue) subsidence. Due to both the changes in e and T, the gradient of M becomes negative in the lowest levels, indicating the presence of a surface-based duct. This shows how subsidence alone in the atmosphere can strengthen or create surface-based ducting conditions.
In the real atmosphere, friction from the surface will often mix the very lowers layers (in the ABL) and raise the sharp gradient layer, as shown later.
|
 |
 |
 |
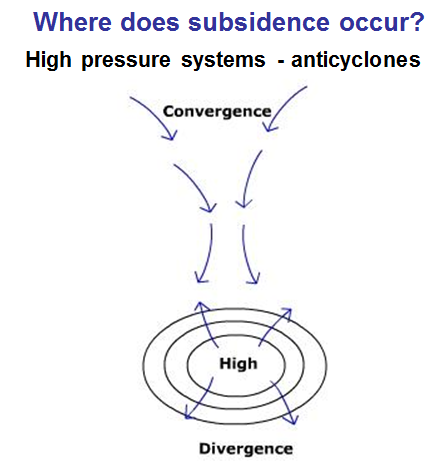
A surface high pressure region (anticyclone) has air which moves out from the high pressure center. This air has to be replace by sinking air from above. This is why high pressure creates subsidence.
|
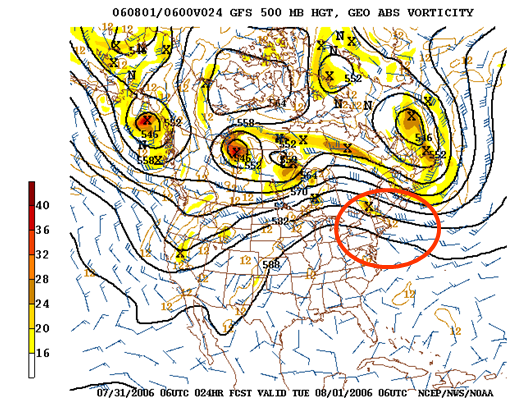
Example of upper level pressure patterns. This a weather map showing the height of the 500 mb pressure surface in dark black lines. The lower part of the map has the highest 500 mb surfaces, indicating higher pressure. Where these line bulge upward, a ridge is present, as in the eastern part of the United States. The downward bulging part in the western US is called a trough. In general, in the mid-latitudes, ridges and troughs move in wave patterns from west to east. The circled red area is therefore in front of the ridge and hence a region where subsidence and possible ducting are likely to occur.
|
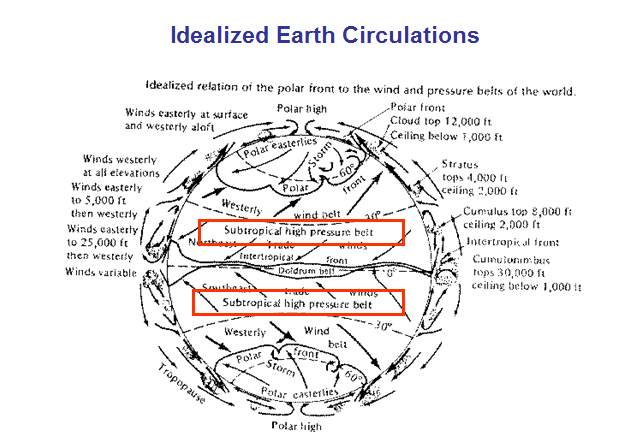
| On the global scale, subsidence is most common in the Subtropical High Pressure Belt (indicated in the red boxes in the figure).
|
 |
| Mixing |
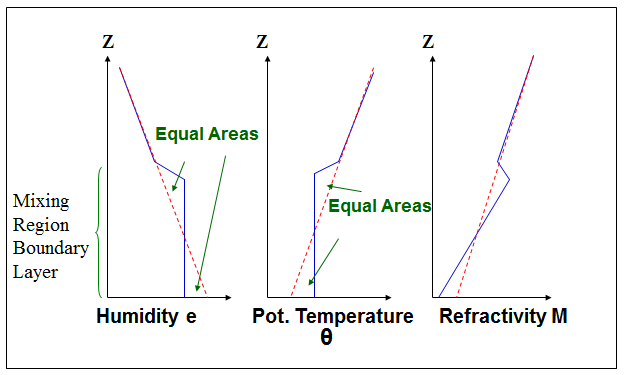 |
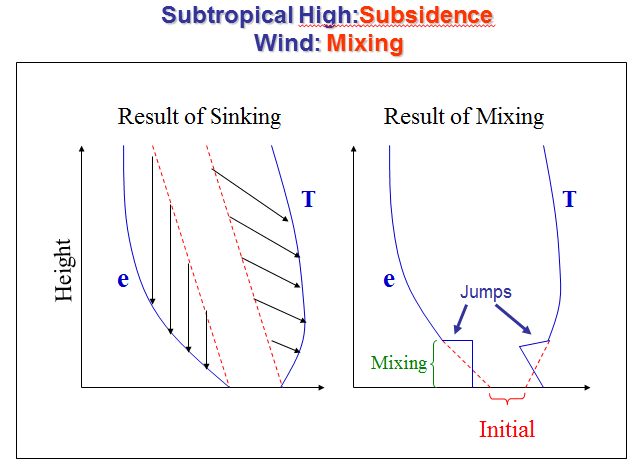
Example of what mixing does to profiles of humidity, potential temperature, and M. The red dashed lines indicate the profiles before mixing, while solid blue indicates profiles after mixing. Because e and θ are conserved, the profiles are vertical in the mixing region. Another consequence of being conserved variables is that for every elevation that e and θ increase, there must be a corresponding region where e and θ decrease. So the areas formed between the pre and post mixing event (indicated by green arrows) must be equal. Above the mixing the profiles remain as before. By cooling and moistening the top part of the mixed layers, jumps occur as the mixed profiles change back to the unmixed profiles.
|
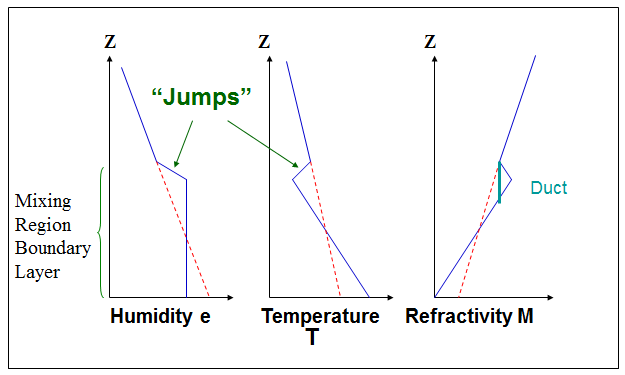 |
Same as previous plots, but now showing Temperature, T instead of Potential Temperature, θ. Both the changes in e and θ after mixing create jumps at the top of the mixed layer, as indicated. Both these jumps contribute to a negative vertical M gradient in the jump region. Such negative vertical gradients in M create trapping layers and associated ducts, as shown in the right plot. In this case the duct is elevated -- it does not reach the surface.
|
|
Where does mixing occur?
Almost always near the surface
-
Unless winds are very light and surface is cold
- Higher winds or warm surface means more mixing and a
higher capping inversion
|
|
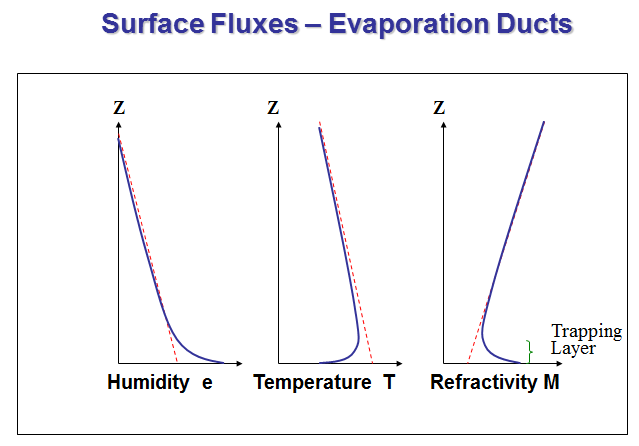
Turbulent surface vertical fluxes (shortened to surface fluxes) provide another ducting formation mechanism. When a surface is moister (higher e) than the air above (as usually happens over a water mass) there will be an upward flux of moisture due to evaporation from the surface. This upward transport makes the region just above the surface (called the surface layer) more moist, as indicated on the left plot. Similarly, a cold surface will cool the surface layer. As a result of these surface fluxes, the initial profiles (red dashed lines) will be transformed to the solid blue line profiles. Note that, unlike the previous two cases (subsidence and mixing), the humidity and temperature variables are not conserved because moisture and heat are being changed due to surface fluxes. Both surface layer moistening and cooling tend to make the M vertical gradient negative, as shown on the right plot. This causes a low level trapping layer and duct. These types of ducts are ubiquitous over oceans due to the effect of humidity fluxes on the lower level e profile. These ducts are called evaporation ducts because this is what creates them. Evaporation ducts will be looked at in more detail in Module 4.
|
Where do surface fluxes occur?
- Surface fluxes are strongest where an air mass moves over a surface with different temperature or humidity conditions such as along a coastline where dry air from land moves over the ocean.
- Radiational warming or cooling of the surface. Surface fluxes occur when the surface is heated by the sun or cooled at night due to longwave radiation from the ground.
|
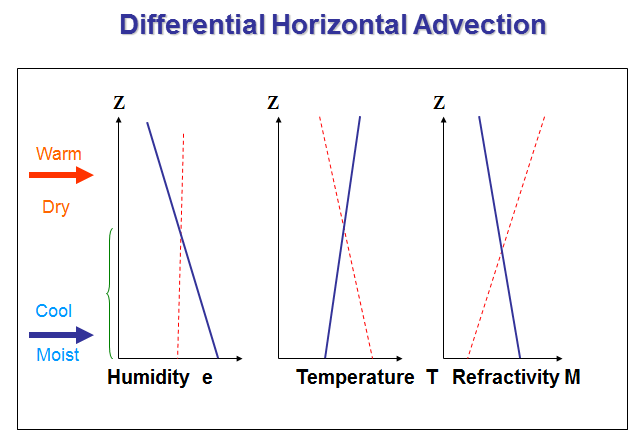 |
Horizontal Advection can be another ducting formation mechanism. Horizontal advection is the movement of air sideways that has a horizontal gradient in some property such as temperature or humidity. In this example a wind from the left to right is bringing in (advecting) warm dry (relative to the existing air mass) air at upper levels and cool moist air at lower levels. This advection causes the changes in the profiles as indicated. These changes also change the M profile as indicated on the right plot. After the advection, the vertical gradient of M has become negative, indicating a trapping layer exists and ducting will occur. Therefore movement of cool moist air at lower levels and/or movement of warm dry air at higher levels may create ducting conditions.
|
| Elevated Temperature or Humidity Sources or Sinks |
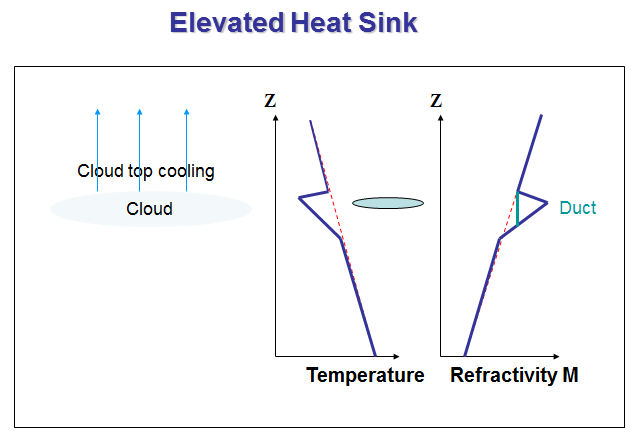
A cloud (indicated by light blue oval) cools at the top due to longwave radiation. This can cause a shallow elevated duct as shown.
|
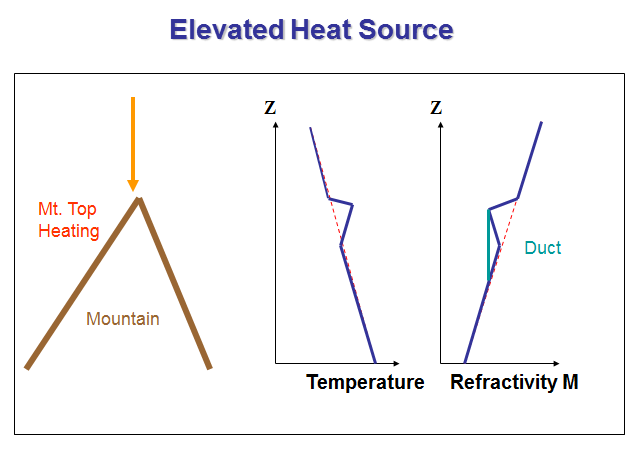
Heating on top of a mountain can also form an elevated duct. This ducting formation mechanism is rare.
|
Summary of Ducting Formation Mechanisms
In order to get duct formation, you need dry air above moist air. Dry air can come from the top (subsidence such as from high pressure systems), or from the side (horizontal advection such as from a nearby desert). Alternatively, moist air can come in near the surface such as from the ocean or a lake. To summarize the formation mechanisms:
- Subsidence
- Mixing
- Surface Fluxes
- Horizontal Advection
- Elevated Temperature or Humidity Sources/Sinks
All of these processes can create temperature inversions (increase in temperature, T, with elevation) and/or humidity inversions (strong decrease in vapor pressure, e, with height). Temperature, and especially, humidity inversions, are associated with a negative vertical gradient in M and therefore ducting conditions.
Next we'll look at an example that shows a combination of these effects. This case is from the Arabian Gulf.
| The Arabian Gulf is in a sub-tropical region where high pressure and the associated subsidence is common. Subsidence alters the e and θ profiles as shown on the left. When the resulting profile is mixed at the surface (right plot) mixed layers and jumps will form. These jumps create negative M gradients and ducting conditions. These profiles of e and T (right plot blue lines) represent a common pattern in the Middle East region.
|
 |
| If the previous profile was formed over land and then moved over the Arabian Gulf in summer, then relatively moist and cool surface would modify the mixed layers (ABLs) as shown. Note how the lowest part of the e profile is moved to the right (greater values) and the lower part of the T profile has moved left (lower values.) This makes ducting more likely and stronger.
A similar situation occurs just off the central and northern California coast. In this case, the air moves from warmer ocean water to colder upwelled water nearer to the coast, which strenghthens the temperature inversion which allows more moisture to be trapped at the lower levels. |
|
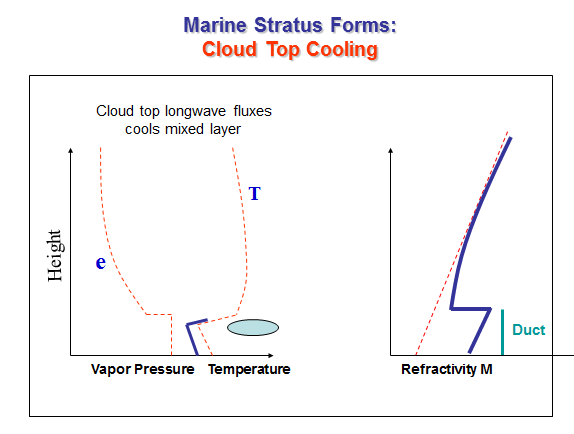
| Clouds often form at the top of the mixed layer. The tops of these clouds cool by longwave radiation, further strengthening the temperature inversion just above the mixed layer (the red dashed line changes to the blue line in the temperature profile shown here).
In the M-profile plot shown to the right, those conditions lead to a change from a standard atmosphere case shown as the red dashed line to the blue profile, and result in a duct (depicted in blue-green).
|
|
| In this example, we see that ducting conditions are most likely to be present and to be stronger when a combination of environmental factors are present.
|