Skip Zones
In this module, we'll look at conditions that can reduce propagation ranges: skip zones, holes, interference patterns and subrefraction.
| Skip Zones | |
| |
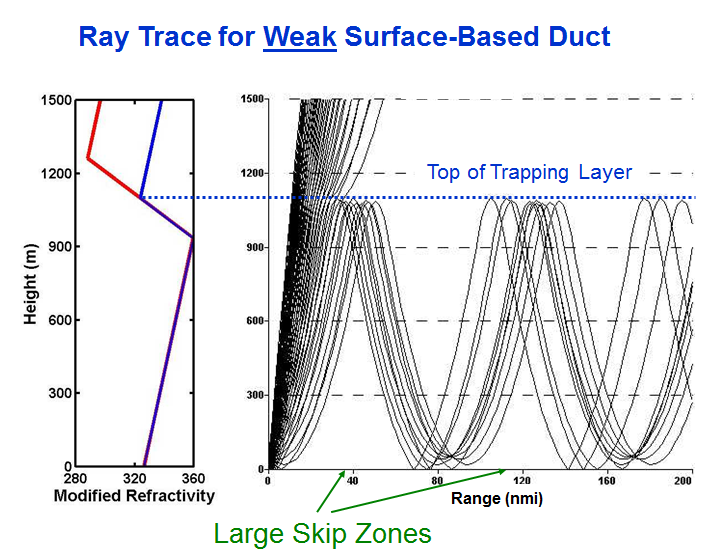
Surface-based ducts can create regions of extended ranges (where rays reach surface). Between these regions are skip zones where no transmissions can occur. |
|
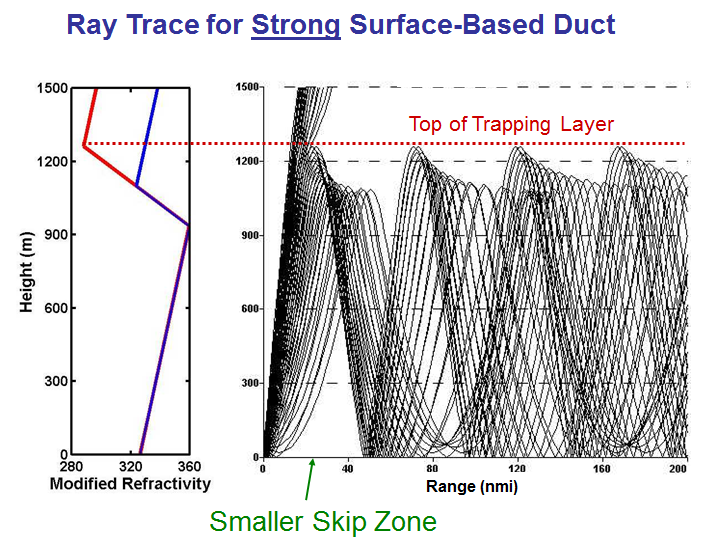
Ducts with a large decrease in M in the upper part of the mixed layer have a smaller first skip zone and the others will be filled in. |
|
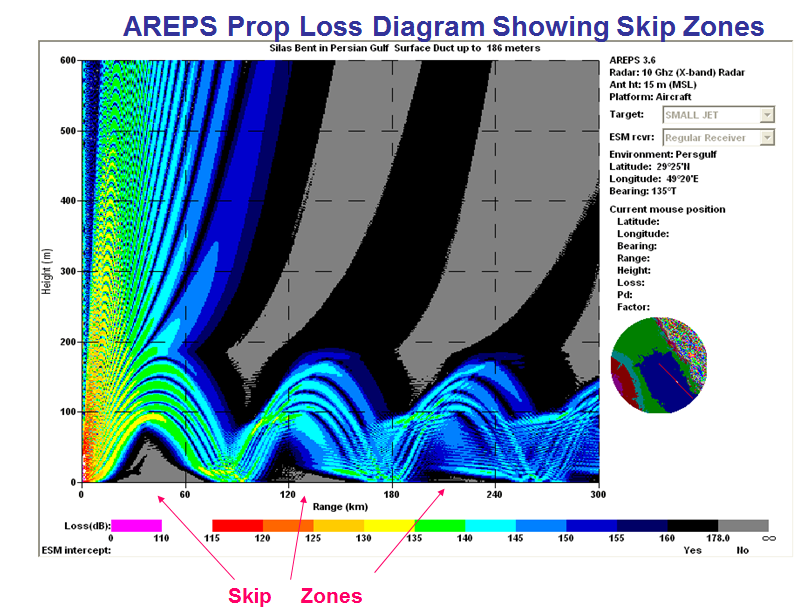
This height vs range cross section of propagation loss (a measure of signal strength) shows a surface transmission in a surfaced-based duct. Similar to the raytrace diagram in the previous figure above, areas of extended range (red, green, blue) are interspersed with skip zones (black, grey) at the surface. This is from AREPS. |
| Interference Patterns
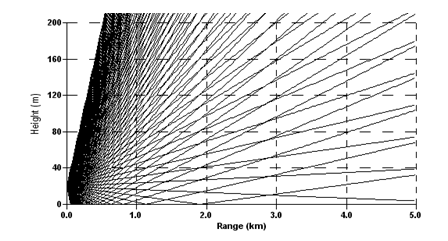
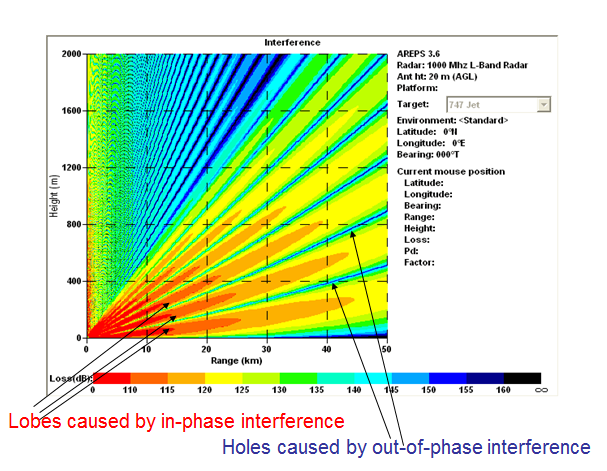
The diagram at right is a ray trace of a transmitter 20 meters above flat surface. When a transmitter is near a surface, especially a flat surface with a high dielectric constant such as sea water, then some rays will bounce of the surface and cross other rays. If the crossing rays are out of phase with each other (due to different path lengths) then they will cancel each other at that location and a hole will be present. Other crossing rays will be in phase and signal strength will be enhanced at that location. |
 |
This is an AREPS propagation loss diagram in a standard atmosphere for a transmitter near the surface. The reflecting rays from the surface create interference patterns that produce this characteristic pattern of stronger signal lobes and weaker signal holes. |
 |
| Holes | |
 |
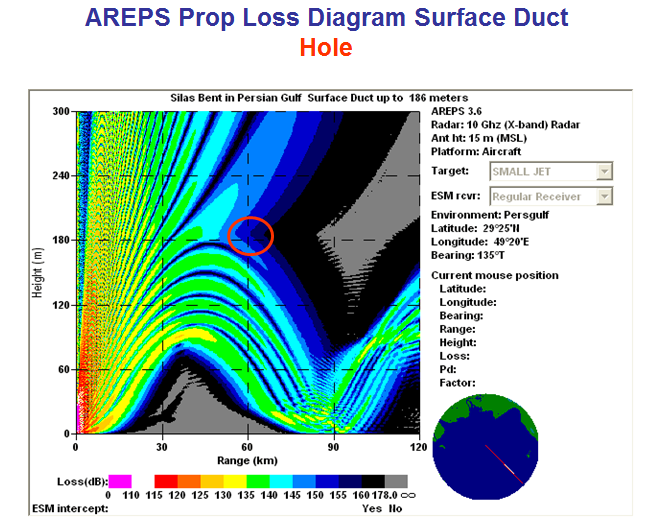 |
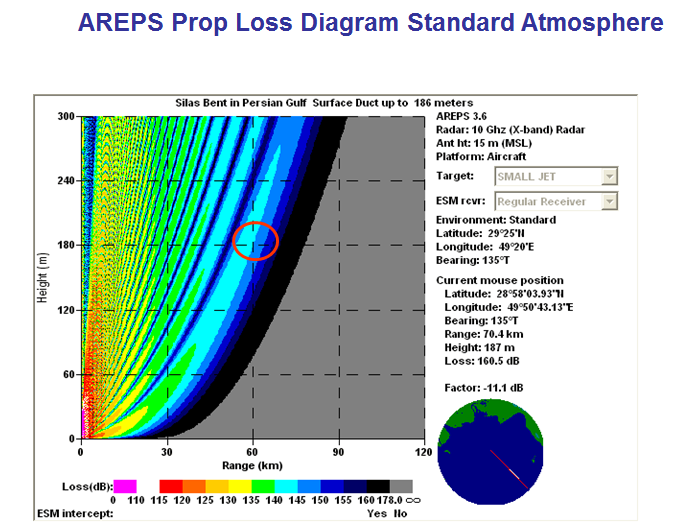
| These two images demonstrate another kind of hole. The diagram at left is a standard atmosphere and is shown here for comparison with the diagram at right, which is when a surface duct is present. The red circle is in the same region for both cases and shows that when a surface duct is present the signal is weaker at this location than for a standard atmosphere. This illustrates a situation when ducting can create holes in regions just above the trapping layer. This is because the ray that in a standard atmosphere would reach the red circle area, is now bent downwards below the region. Higher rays never bend down enough to reach the red circle region either. | |
| This is a schematic showing the presence of a hole above the elevated trapping layer. This diagram shows how a hole can be used to tactical advantage to hide an aircraft. Features such as this work both ways, signals have difficulty going from the aircraft to the surface (not shown) if the aircraft is in a hole for a surface radar. An aircraft in this type of hole will have decreased air-to-surface ranges compared to locations lower (in the duct) or higher in the atmosphere (line-of-sight). | 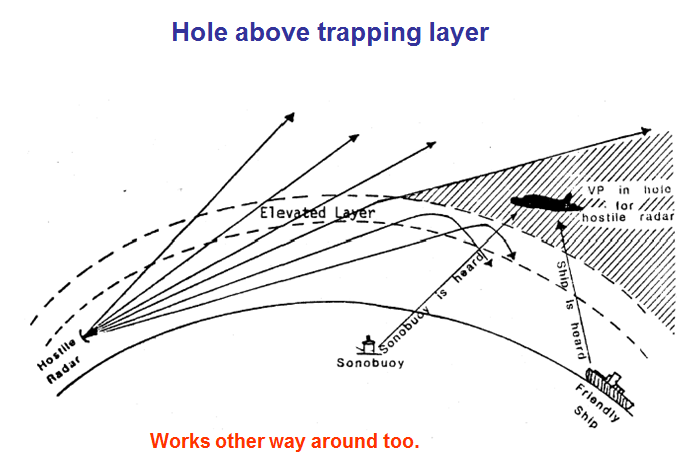 |
| Subrefraction and Fadeouts
The last phenomenon we'll look at that decreases propagation range is subrefraction. Remember subrefraction is when rays bend upward, i.e. the vertical gradient of N is positive, i.e.,
|
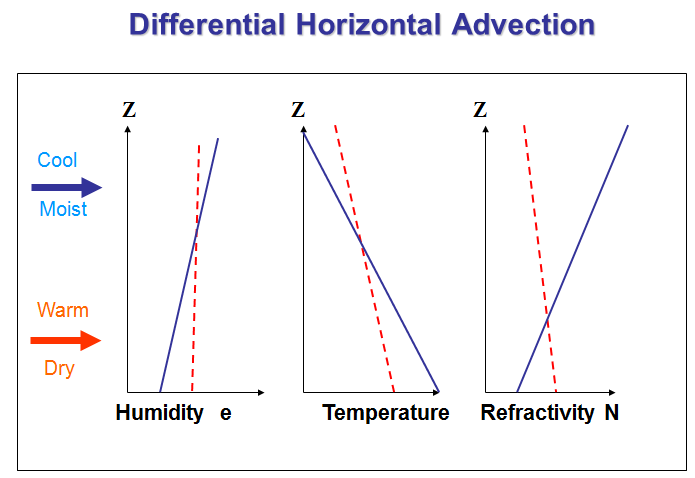
In these plots, the red dashed line represents a standard atmosphere, while the blue line shows the situation being discussed. First we'll look at differential horizontal advection. This is the opposite of the advection case that caused ducting. In this case the cool moist air is higher. This advection changes the N profile as shown; rays bend upward (subrefraction), the Rf horizon is closer and ranges are decreased. We are showing N now instead of M because subrefraction is easier to visualize on an N plot (it is where the vertical gradient is negative). |
 |
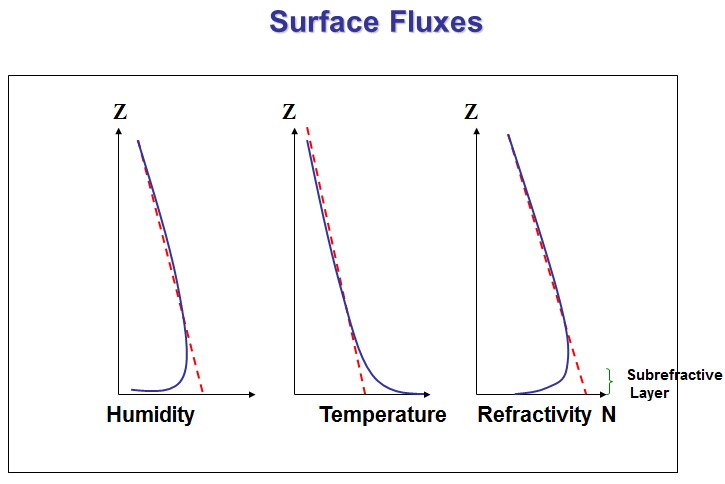
Humidity flux toward the surface (such as moist air over a dry desert) or a heat flux away from the surface (such as on a hot sunny day) can cause N to become positive and create subrefractive conditions. |
 |
| Here is a situation illustrating subrefractive conditions. Cool moist air from an ocean blows over a hot dry surface. The changes in temperature and humidity close to the surface make rays bend upward. Targets in the hot dry region will be harder to detect than during standard (no advection or fluxes) conditions | 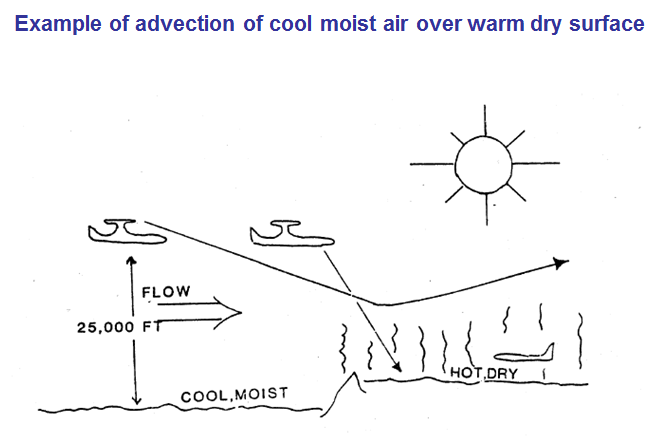 |
| Here is a third example of a subrefractive situation. This situation occurs in a saturated air mass over cold water. The movement of air over the cold surface cools the lowest part of the atmosphere, as shown in the middle plot. Because the air already contains enough water vapor to be saturated, further cooling causes some of the water vapor to condense out of the air and the total amount of water vapor near the surface will decrease, as shown in the left plot. A humidity profile that increases with elevation can cause the refractivity gradient to become positive near the surface. The increase in temperature near the surface would tend to counteract that effect, but the humidity effects are stronger and dominate over the temperature effects. | 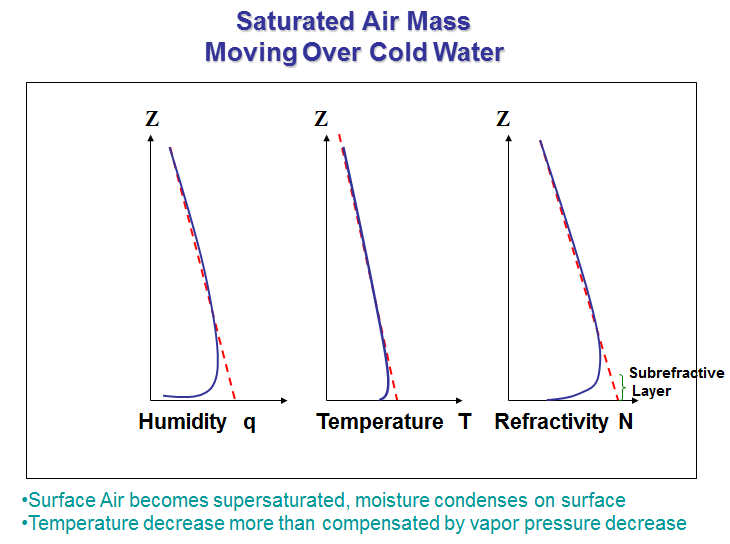 |
| The saturation vapor pressure (es) increases geometrically with increasing temperature. In saturated air, the temperature controls the amount of water vapor (e) and therefore M or N values. Saturated air occurs in clouds and near the surface in foggy regions. | 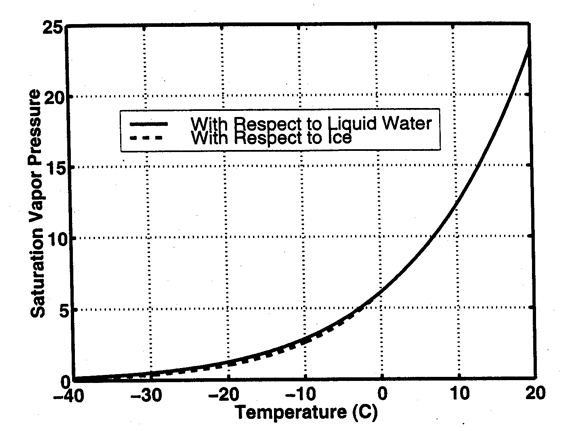 |
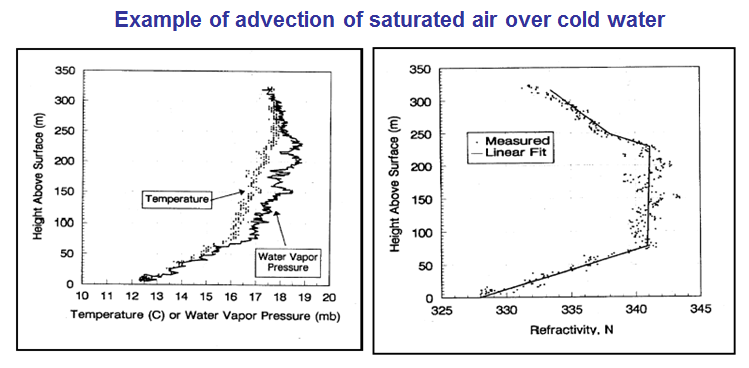 The plots above are from an actual sounding during a situation when Rf ranges were observed to be less than normal. The left plot shows the temperature and vapor pressure vertical profile in a saturated air mass over cold water. The right plot shows the resulting N profile; note strong positive slope in N near the surface, indicating subrefractive conditions. |
|