By using M, it is easy to visually identify ducts and trapping layers on a plot of M vs. Z. In this case, we see an elevated duct where the duct is above the surface. Next we'll look at types of ducts that reach the surface.
Ducts are atmospheric layers formed when M decreases with height. Radar or other EM waves can be trapped within ducts and may propagate over much greater distances than normally expected.
In this module, we will look at the various types of ducts - and then take a closer look at surface-based ducts.
|
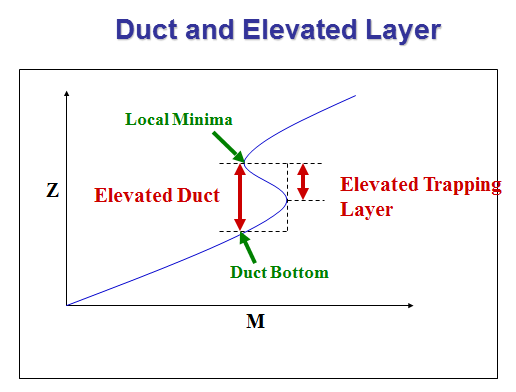
This plot shows Modified Refractivity, M, vs Elevation, Z. The region where dM/dZ is negative is a trapping layer where rays will bend downward more than the Earths curvature. Drawing a vertical line from the local minima in M at the top of the trapping layer downward will indicate the lower region of the duct. This is where the line intersects M below the trapping layer.
By using M, it is easy to visually identify ducts and trapping layers on a plot of M vs. Z. In this case, we see an elevated duct where the duct is above the surface. Next we'll look at types of ducts that reach the surface. |
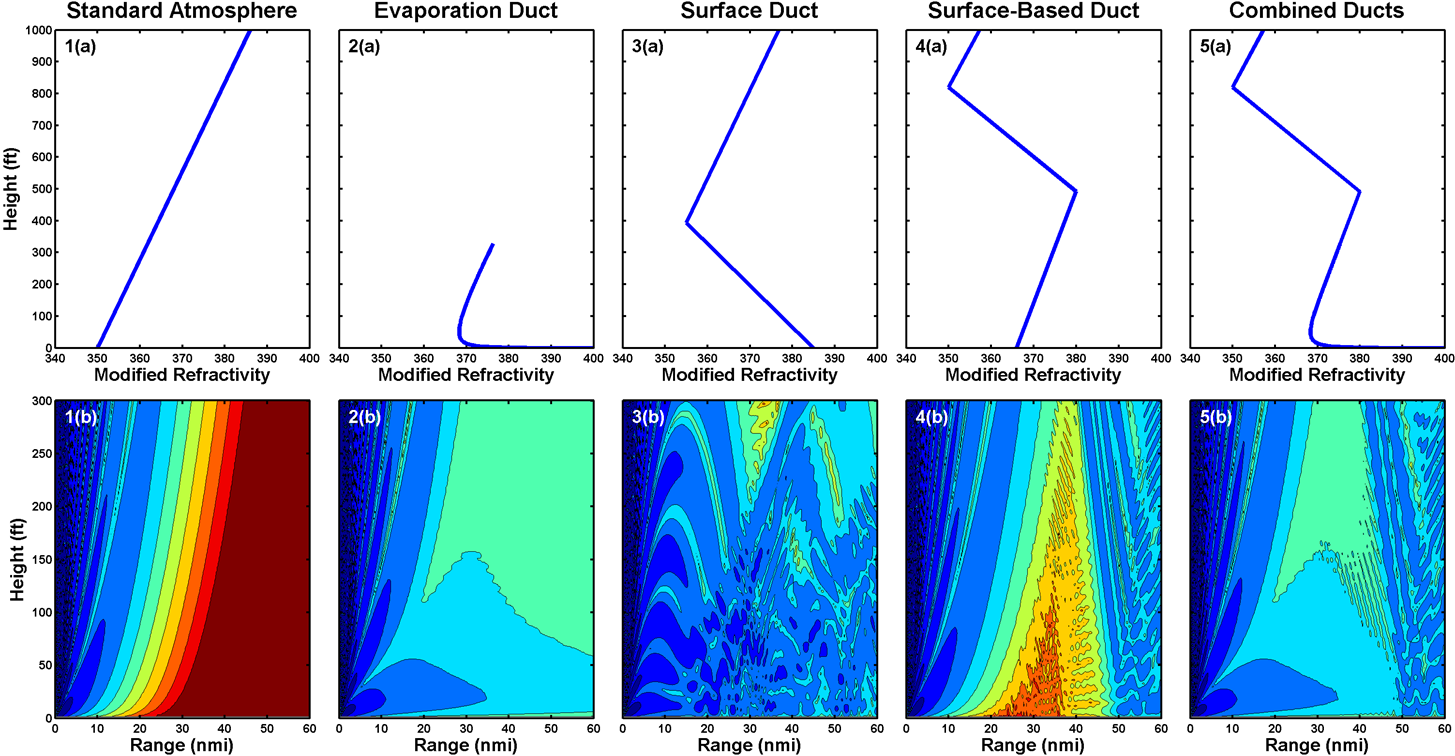 |
| The top row of plots shows modified refractivity, M, as a function of height for various atmospheric conditions. The bottom plots show predicted signal strength from a transmitter near the surface. Blue indicates strong signals, red indicates weak or no signal. The left panels show a standard atmosphere-- note M changes at a constant rate with height, the gradient is always positive so there is no duct, and ranges are normal. The next four plots show various types of ducts that reach the surface. We'll discuss surface-based ducts in more detail next. |
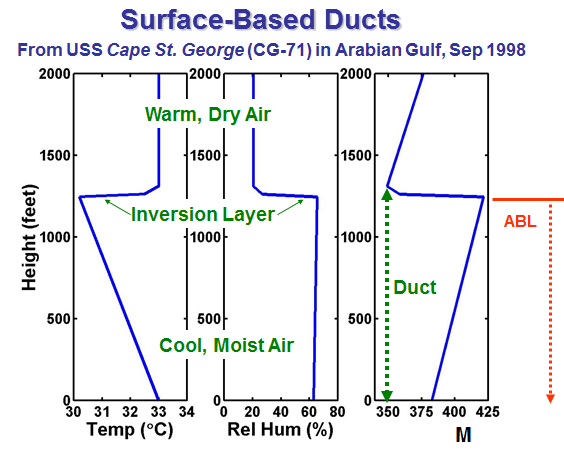 |
Vertical plots of Temperature, Relative Humidity and Modified Refractivity, M from an actual rawinsonde sounding. Notice that both the decrease in humidity and increase in temperature above the cool moist atmospheric boundary layer (ABL) contribute to the ducting, but the humidity decrease is the more important effect. The green dashed vertical line in the M plot shows the duct region. It extends to the surface, indicating a surface-based duct is present. | |
 |
Rays within a surface-based duct behave similar to skywaves for HF radiation with skip zones and bounce regions. However, because the duct top is much lower than the ionosphere, the skip zones and bounces are also much shorter than for skywaves. |
 |  |
|
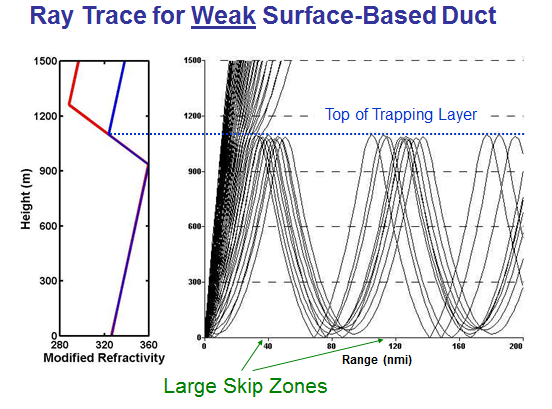
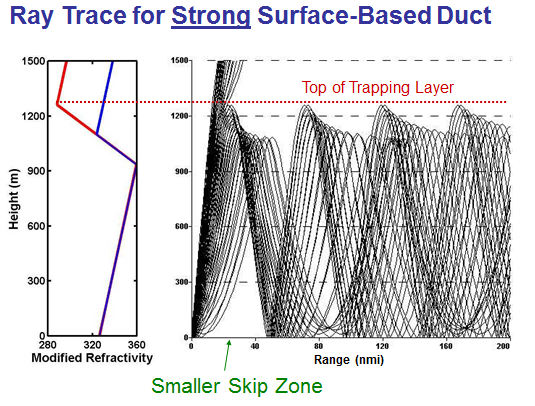
| Weaker ducts, as measured by the M local minima, produce relatively large skip zones. | Stronger ducts produce a relatively small first skip zone and the later skip zones are filled in. |
Now we return our focus to ducting conditions. What locations on earth have the most likelihood of ducting?
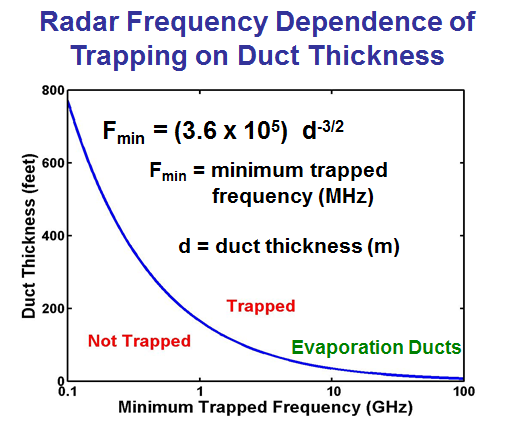 |
Although N and M do not depend on frequency in the VHF-EHF ranges, frequency can be a factor in whether EM radiation is trapped. Low frequency radiation with long wavelengths requires deeper ducts to be trapped than higher frequencies. The above equation applies when duct thickness is measured in meters and frequency in MHz. The plot shows thickness in feet and frequency in GHz. Frequencies below Fmin will not be completely trapped. However Fmin is not a hard cut-off -- the change from ducting to non-ducting conditions around Fmin is gradual so frequencies below but near Fmin will not be completely trapped, but they will have greatly extended ranges from standard cases.
This frequency dependence (and interference effects) can not be simulated by ray trace models of EM propagation so use caution when interpreting ray trace results. |
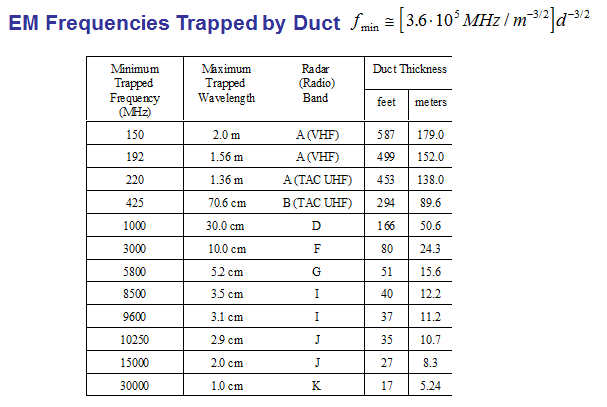 |
Table showing various frequencies and associated duct thicknesses.
The surface-basic ducts caused by an inversion layer ducts we have discussed so far are usually thicker than 200 meters so for most frequencies, trapping will occur if negative M gradients are present. However, we will study the much lower (5 20 m) evaporation ducts. For these the minimum frequency is an important consideration when estimating ducting conditions. |