| |Boundary Layers| | |Mixed Layers| | |Ekman Layers| |

| |Boundary Layers| | |Mixed Layers| | |Ekman Layers| |
In the interior of the ocean, far away from the surface and bottom boundaries, the frictional forces may be very small in comparison to other forces at work. Near the upper and lower boundaries however, friction becomes more important. At the surface of the ocean, the stress must match the wind stress. At the bottom of the ocean, the flow generally goes to zero. The portions of the water column near the surface and the bottom where the flow adjusts from its surface value to its interior value are called the surface and bottom boundary layers. Modeling these portions of the water column accurately requires special considerations.
Under certain conditions, when the surface stress is large and the stratification is small, the ocean becomes mixed, such that all properties, velocity, temperature and salinity, are nearly uniform in the vertical for a certain distance away from the upper and/or lower boundaries. These are known as mixed layers, and the thickness of such a layer is the mixed layer depth, MLD. Various criteria, generally relating to the ratio of shear to stratification, are applied in models to determine when, and to what depth, mixing should take place.
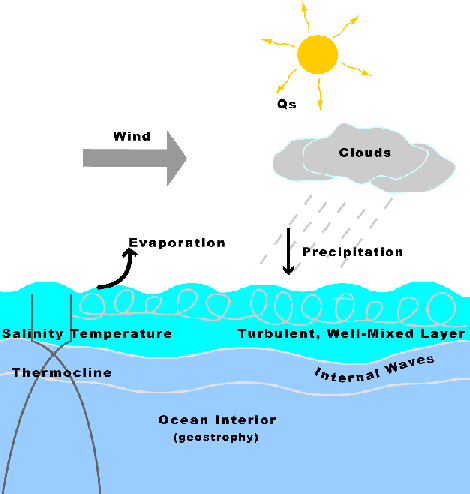
The mixed layer at the top of the ocean is very important as it forms part of the air-ocean boundary layer system, and is dominated by wind mixing and heat exchanges at the air-sea interface (Figure below). Mixed layers can develop over different time scales, or a combination of scales. For example, the MLD deepens and shallows with the passage of the seasons, while a diurnal mixed layer shallows and deepens over 24 hours.

The above schematic depicts the major processes acting on and in the ocean surface mixed layer.
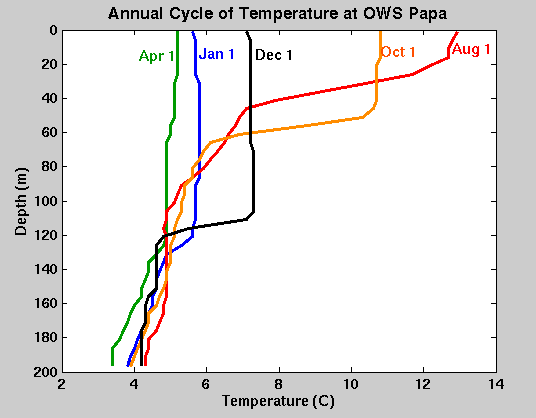
The seasonal thermocline is most evident in mid-latitudes. During the winter the surface is cold and winter storms deepen the mixed layer. In the summer the surface temperature rises, the water becomes more stable and a seasonal thermocline (depth at which the vertical temperature gradient is a maximum) forms in the upper zone. Play this quicktime movie, which shows a typical annual temperature cycle in the north Pacific Ocean at 50oN. The data that make up this movie consist of more than 2000 temperature profiles from bathythermographs (BTs) during 1966 at Ocean Weather Station Papa. The following figure shows selected profiles from this same data/movie to help you understand the progression that you see in the movie.

Between January 1 and April 1, we see that the temperature cools and the mixed later deepens to about 120m. In the spring and summer, the water warms and the mixed layer becomes shallow, reaching its shallowest point by August. In the late summer and fall, the surface cools and the mixed layer deepens, and the cycle begins again.
Heating during the day also causes the water column to stabilize and the mixed layer to shallow while heat loss at night and wind mixing cause it to deepen.
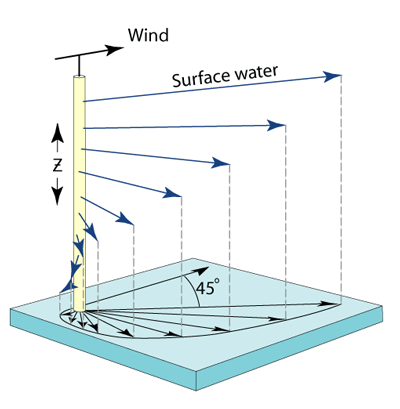
An Ekman layer is one model for how surface stress decays away from the boundary toward the interior of the ocean. The Ekman equations, another approximation to the equations of motion, assume that the dominant balance is between the frictional force and the Coriolis force. The velocity vector then has the form of a spiral, turning and decaying in amplitude, away from the ocean's surface toward the interior, or away from the interior toward the ocean's bottom.

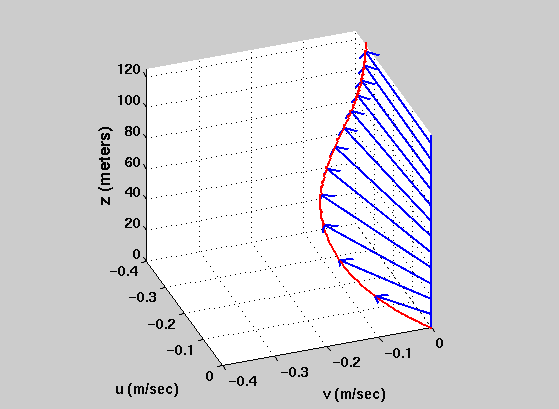
In a bottom Ekman layer, the flow is to the left of the interior flow in the northern hemisphere. In the following figure, which shows the direction of the velocity vector from 125 m above the bottom to the bottom, the geostrophic velocity equals 0.35 m/s and the Ekman depth (the depth over which the surface, in this case the bottom, friction influences the velocity) equals 100 m.

Very close to the bottom, the turbulent eddies become "squashed". This is equivalent to thinking of the eddy diffusivity varying with depth. In the thin layer near the bottom where this happens, the stress is nearly constant with depth, but the velocity decreases rapidly as the bottom is approached, according to a logarithmic profile. This log layer is much thinner than the Ekman layer. There is an even thinner layer closer to the bottom where molecular viscosity becomes important.