Building MISO
Building the Inner Shelf Cabled Instrument System
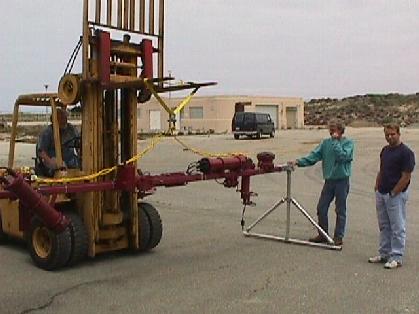
A stainless steel instrument frame was constructed at NPS to mount oceanographic instruments about 1m
above the sandy bed. The frame and instruments were assembled at the marine operations building at NPS,
then trucked up to the "John Martin" research vessel at
Moss Landing Marine Labs and loaded on to the boat by crane. When the boat was at the selected site in 12m
depth, offshore from the marine operations building, the frame was lowered to the bed and "jetted" into the sandy bed
using water jets guided by divers. The following day the multi fiber and conductor cable was pulled offshore from the
Marine operations building and connected to the instrument central electronics package by divers. The rugged instrument
frame and high bandwidth communications and power cable allow long term observations of inner shelf processes using sophisticated
instrument systems.
The instruments on the frame and their function are listed below:
![[Image of Paroscientific Pressure Sensor]](Pressure.jpg)
- A high precision digital pressure sensor measures the
height of water above the frame, to produce a record of tides and long period waves. The power spectrum of
the surface waves can be calculated from these pressure timeseries.
![[Image of Acoustic Doppler Current Profiler]](adcp1.jpg)
- An Acoustic Doppler Current Profiler (ADCP) measures
the water current every 1m (39") from the frame to the near ocean surface. This allows the mean currents and
wave signatures of surface waves to be determined.
![[Image of Bistatic Coherent Doppler Velocimeter and Sediment Profiler]](BDVSP.jpg)
- A high resolution
Bistatic Coherent Doppler Velocity and Sediment Profiler (BCDVSP) developed at NPS by the
ocean turbulence research group measures the complete velocity vector and sediment concentration every
1cm over a 60 cm range above the bed. These small scale measurements are used to define the mean and turbulent
structure of the water column above the sandy bed which results from mean currents and wave induced curents interacting
with the bed.
![[Image of Scanning X/Y Altimeter]](altpic.jpg)
- A scanning Acoustic Altimeter (SAA) developed by the
ocean turbulence research group continuously maps the sandy bed below the BCDVSP. It is now set up to scan
a 2m by 2m area wth .5cm vertical and 2cm horizontal resolution, allowing the changing bumps and ripples on the bed
to be measured even in optically opaque, turbid water conditions.
- A Structured Light And Camera (SLAC) developed by the
ocean turbulence research group continuously images
a 1m by 1m area under the BCDVSP. The small scale bed forms can be quantified using thin sheets of light which illuminate
parts of the sandy bed.
Last Reviewed: February 2003
stanton@nps.edu
Disclaimer
Privacy and Security Notice
Disclaimer for External Links
Material contained herein is made available for the purpose of
peer review and discussion and does not necessarily reflect the the
views of the Department of the Navy or the Department of Defense.