Final Project Summary
Multiquadric Analysis as an Alternative
to Objective Analysis
where c indicates the amount of curvature of the hyperboloid. The choice of c is subjective and can have adverse effects if poorly chosen. If c is too large, the field will be over-smoothed while c too large will cause the matrix to become ill conditioned. The interpolation equation introduces another seemingly subjective parameter, k:
k can be held relatively constant, however, and only needs to be adjusted for scale changes (using data scaled onto a one by one grid allows k to be held constant with no adverse affects on the analysis).
Although there is less subjectivity involved in MQ than there is in OA, MQ is more computationally intensive than some sophisticated methods of OA.
One of the major advantages of MQ is the lack of dependence on a length scale. When using OA, the length scale must be specified for the entire data set. If the data field contains some areas with dense coverage and others with sparse coverage, it can lead to difficulty in choosing an appropriate length scale (L). If L is chosen to be appropriate for the densely covered area, the data-sparse area may have fictitious small-scale features in the analysis. Conversely, if L is chosen to be appropriate for the sparsely covered area, real small-scale features in the data-dense area may be overlooked. Using MQ, real small-scale features are retained in data-dense areas and only real large-scale features are indicated in data-sparse areas.

Figure 1. An example of multiquadric analysis used on the surface wind field in the Monterey Bay area (click on figure or see first link below).
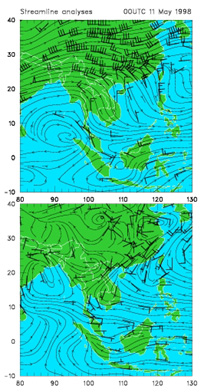
Figure 2. Streamline analyses at 200 hPa (top panel) and at 850 hPa (bottom panel) for 0000 UTC 11 May 1998 showing pre-onset flow conditions. Observations at sounding sites are indicated (click on figure or see third link below).
Barnes, S. A., 1995: Comments on Use
of multiquadric interpolation for meteorological objective analysis. Monthly
Weather Review, 123, 2255-2256.
Nuss, W.A., 1995: Reply. Monthly Weather
Review, 123, 2257-2261.
South
China Sea Monsoon Experiment (SCSMEX) & GEWEX Asian Monsoon Experiment
(GAME)
| This is a government-maintained internet site. Please read the U.S. Navy web page disclaimerand the disclaimer regarding external links. |
|