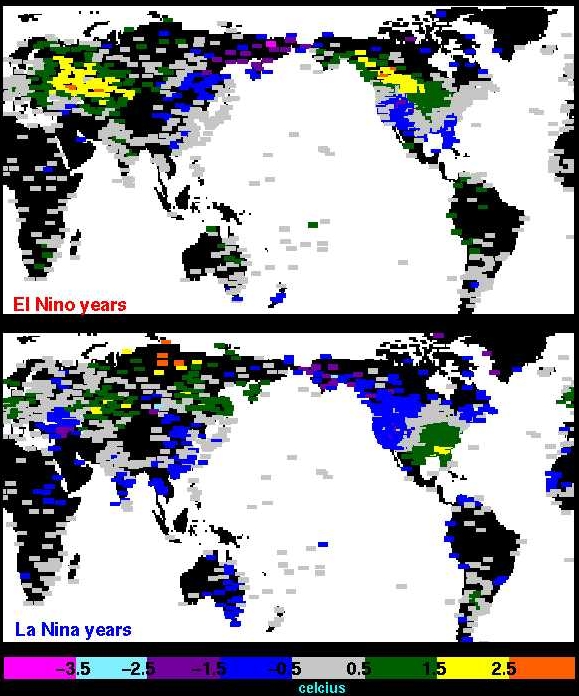
Temperature anomalies associated with ENSO
These are stills taken from an animation by Phaedra Green at Florida State University's
Center for Ocean-Atmospheric Prediction Studies. The anomalies were created from 40
years of data. The data were seperated as occuring during an
El Niño year, a
La Niña year, or a neutral year. The data within these three catagories were then
averaged, and the differences between the El Niño
(La Niña) and
neutral average were taken for each station. The pictures deplict an average
temperature anomaly field during a a La Niña or
El Niño.