How does an El Niño and La Niña
compare to a normal scenario?
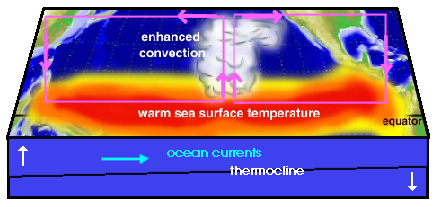
a. El Niño
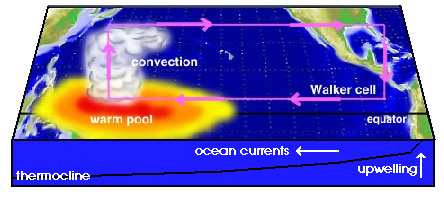
b. Normal scenario
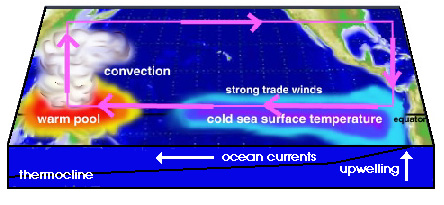
c. La Niña
 Note that the location of the jetstream is influenced by the location of the convection, e.g. the main
mean jetstream for La Niña starts to the left of the normal scenario. These
are the teleconnections to our mid-latitude weather.
Note that the location of the jetstream is influenced by the location of the convection, e.g. the main
mean jetstream for La Niña starts to the left of the normal scenario. These
are the teleconnections to our mid-latitude weather.
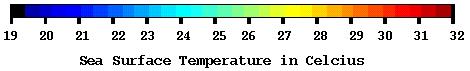
The following graphics show the temperature distribution in the Pacific Ocean for
a La Niña, a normal year, and an El Niño.
La Niña
Dec. 1988 |
 |
Normal
Dec. 1990 |
 |
El Niño
Dec. 1997 |
 |