Naval Postgraduate School OC3902
FUNDAMENTALS OF MAPPING,
CHARTING, AND GEODESY
Lab 5: ArcGIS Part-3
Importing text files to ArcView
In this lab, you practice how to import your own data (as text
table file) and make contour and vector plot using ArcMap.
Please copy the directory lab5_ArcGIS_part3 with all the
data files to your working directory from \\lrcapps\common$\OC3902\FY09Qtr1,
and work in your own directory.
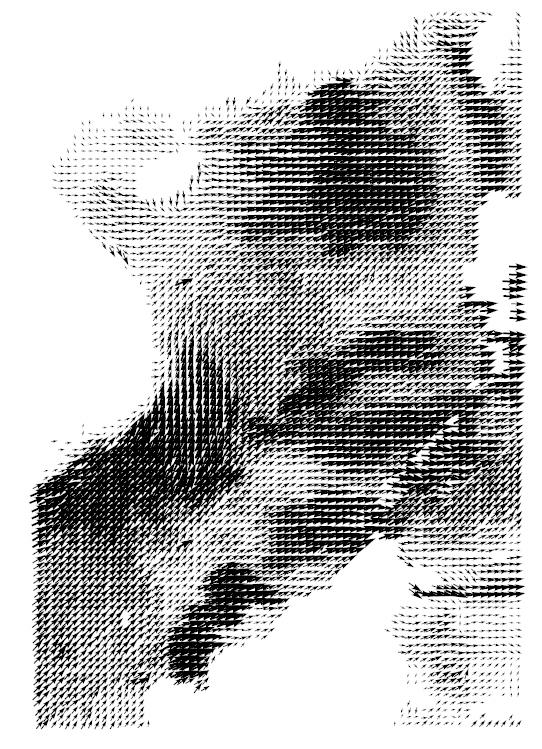
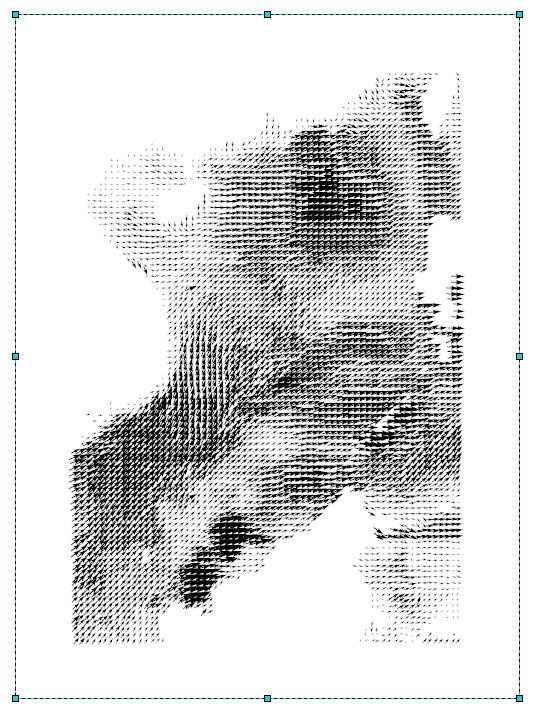
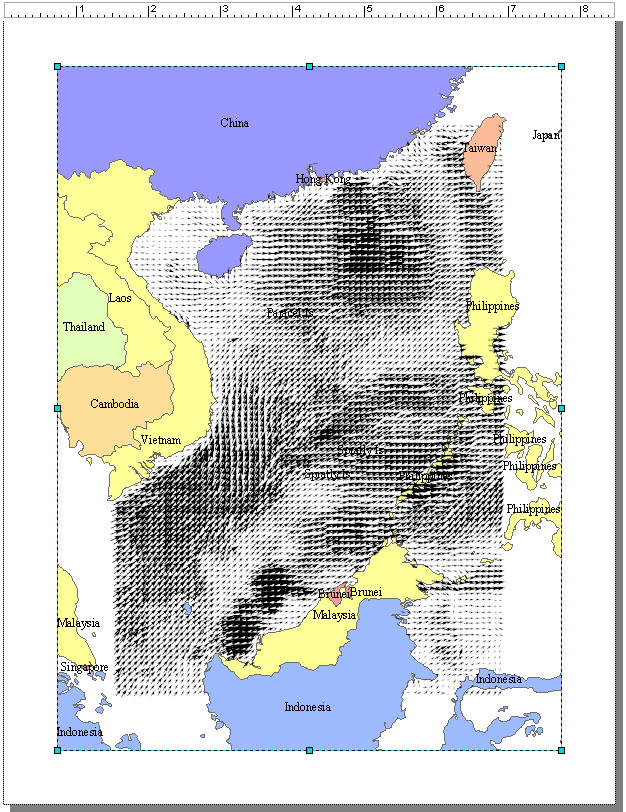
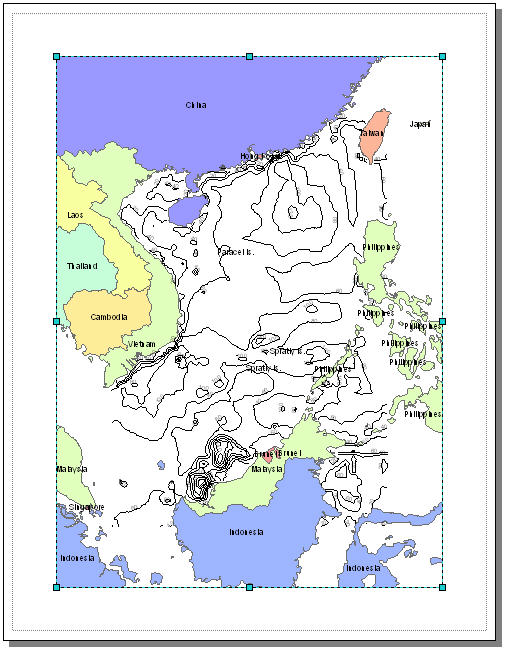
Plotting wind
velocity vectors on the South China Sea
map using ArcView
Part A: Vector Plot
1.
Import
the text table file of the south china sea winds, “ww3Wind.csv” data as Add xy data.
Open ArcMap to start a new empty map
Mainlbar > Tools > Add XY Data… to open
Add XY Data Catalog.
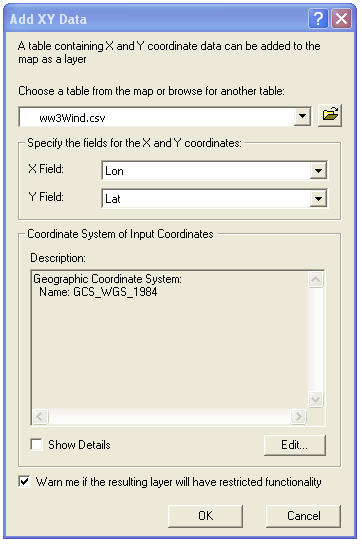
Choose:
Table: “ww3Wind.csv”
X Field: Lon
Y Field: Lat
Coordinate System:
Edit…> Select…> Geographic coordinate Systems > World > WGS
1984
Click “OK”.
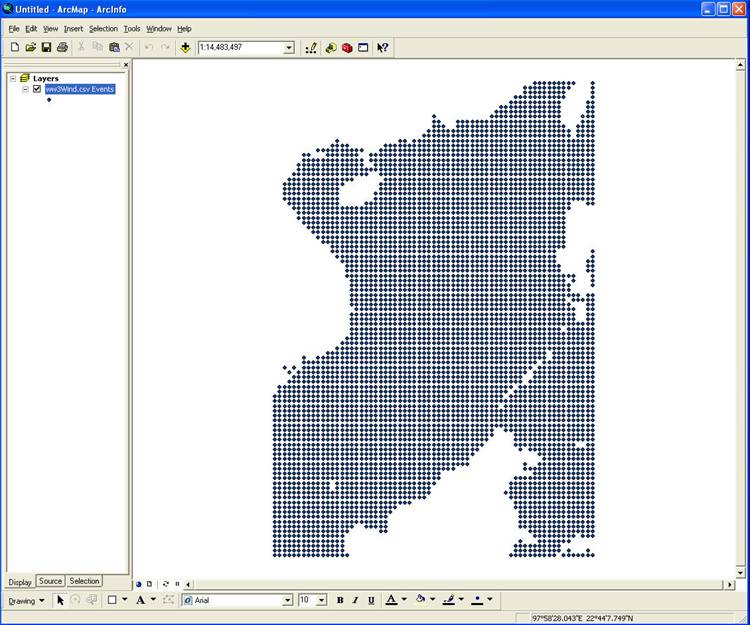
Preview
data
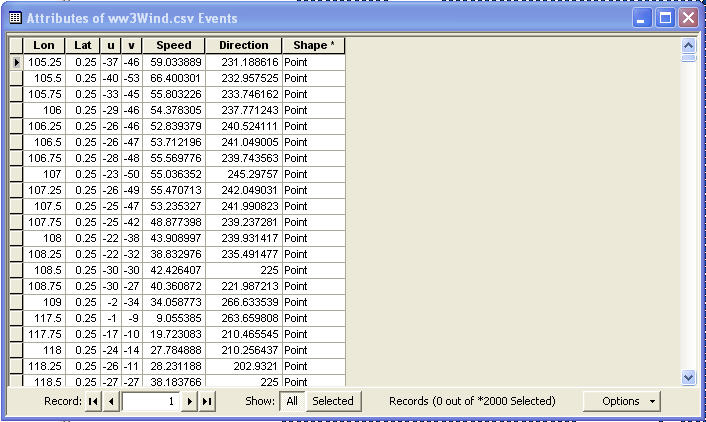
Right click
on “ww3Wind.csv Events” pull down “ Open
attribute table”.
2.
Change Symbol from simple marker symbol to “Cutting Plane Arrow”.
Click the symbol on the left window to open
Symbol Selector Catalog.
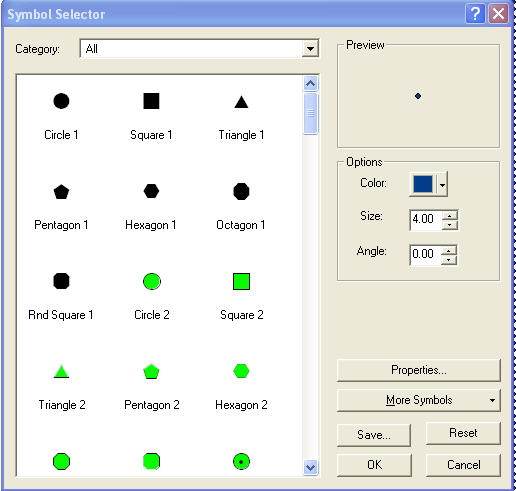
Pull down to find symbol “Cutting Plane Arrow”,
if you can not find it, click “More symbols” button in the Symbol Selector
Catalog to add more symbols, select “dimension”. Now you can find it.
All the arrows have same size and direction.
You need to adjust the arrow symbol size by the speed and rotation by the
direction.
Right click on ww3wind.csvEvents >
Properties… to open Layer Properties Catalog .
Click
Quantities choose the Graduated Symbol in the Layer Properties Catalog.
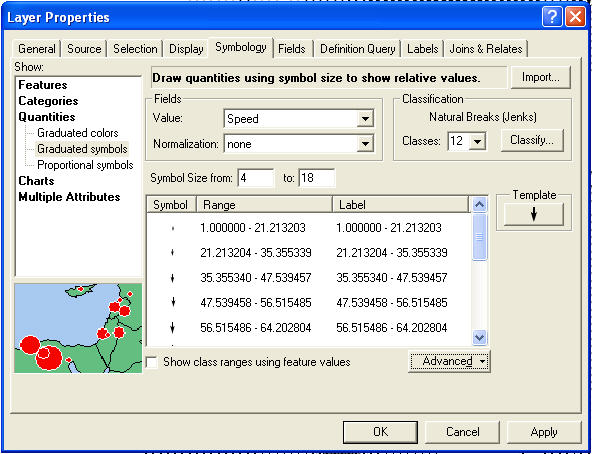
Click “Advanced” button select “rotation…”. In
the rotation Catalog, pull down
“Direction” in Rotate Points by Angle in this field, and mark
“Arithmetic” in Rotation Style.
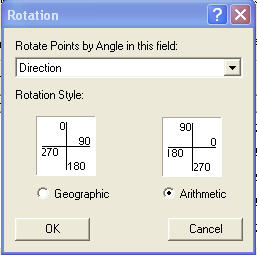
Click OK.
2.
Change
Symbol from simple marker symbol to “Cutting Plane Arrow”.
3. Click “view” in main menu bar and pull down to tool bar, select “tools” to open the Tools Catalog.
Use “zoom in” and “Pan” buttons in the tool bar to change the region from global to south China sea. Change the map view from data view to Layout view.
4. You can add regional map from ESRI data base.
Click the “add data” button in the standard tool bar.
In “Add Data” Catalog Go to \\lrcapps\common$\OC3902\ESRIdata\CD1(World
and Europe)\world\ from your ArcCatalog.
If there is no this folder in your ArcCatalog, use add button to add the folder to your Catalog. Add the data file 1992 CountryBoundaries.lyr.
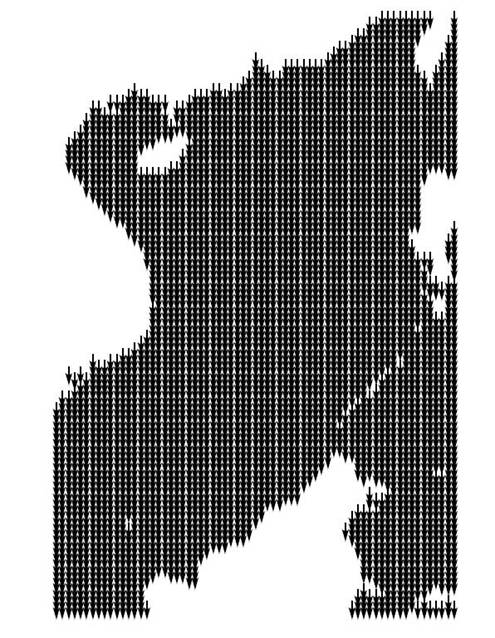
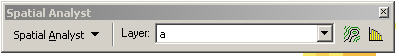
Part B: Contour plotting wind speed on
Note: contour plot
needs “Spatial Analyst” tool. Add Spatial Analyst tool in your tools bar as:
right click “view” in the main manual bar then mark on Spatial Analyst. If the
Spatial Analyst tool doesn’t work, you have to mark “Spatial Analyst” from
->tools -> Extensions.
1.
Import
the text table file for the
2.
Mark
ww3Wind.csv.Events using the Symbol marker.
3.
Open
“Spatial Analyst” Catalog: Spatial Analyst bar > Convert > Features to
Raster.
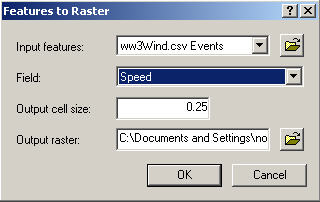
4.
In the
“Features to Raster” Catalog, select ww3Wind.csv.Events as input features,
Speed as Field and 0.25 as Output cell size.
5.
In the
“Spatial Analyst” Catalog, click “Spatial Analyst” and pull down “Surface Analysis “ >> “ Contour”.
6.
Change
contour interval to 20 in the “Contour” Catalog.
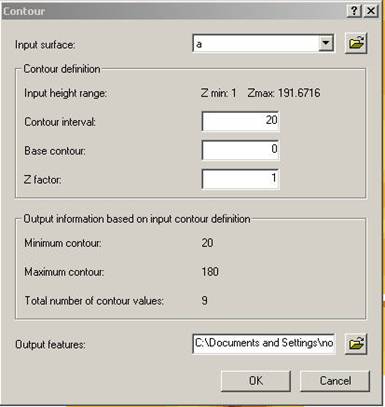
Click OK.
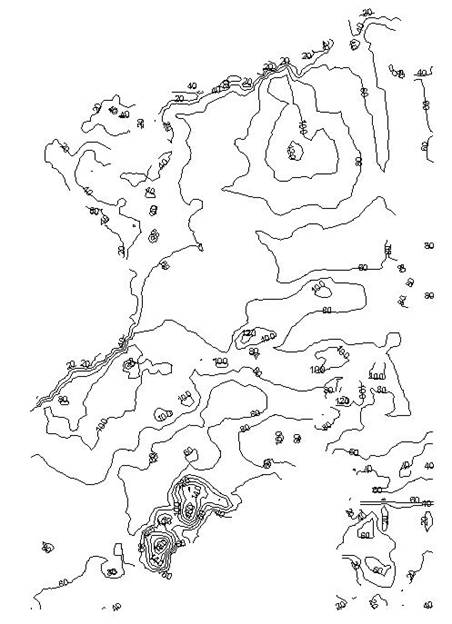
7.
Make
the contour labels:
Right click on contour layer > Properties > Labels > Marker Label
features in this layer > Placement Properties > marker “Parallel”. On the line, remove duplicate labels. You can
mark out level “a” to clear color.
8.
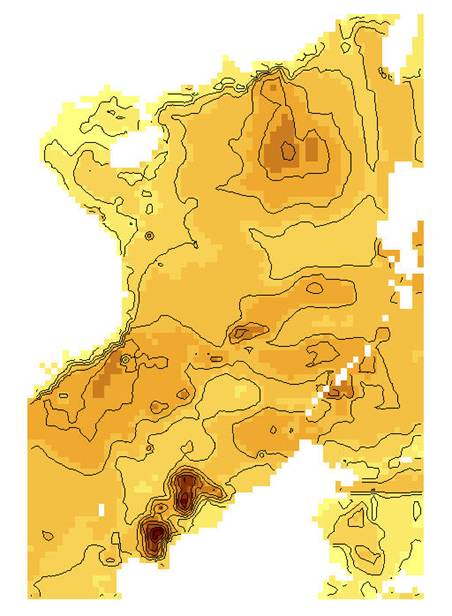
Draw
the
Save Part-A and Part-B results
as jpg files and email to fan@nps.edu.
(Back to "Labs
List" page.)
Last Updated 29 September, 2008
POC: Peter Chu