All matter consists of positively-charged protons and negatively-charged electrons. (There are other "subatomic" particles, but we don't need to concern ourselves with these here.) For most matter that we are familiar with (gases, liquids and solids) one or more protons are grouped together to form a nucleus hile electrons swarm around them; this is called an atom. A "neutral" atom has the same number of electrons and protons; this it the typical situation here on the surface of the earth. Earlier we discussed how in the ionosphere, radiation and particles from the sun can knock electrons away from atoms, resulting in negatively-charged "free electrons" and positively-charged ions. The amount of free electrons that are present is called the electron density.
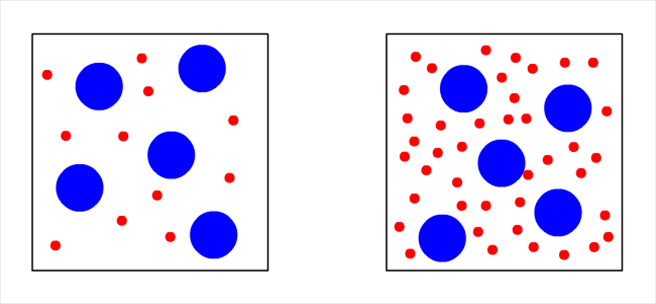
Free electrons are not attached to a particular nucleus. Matter in this form is called "plasma". In a plasma, the negative free electrons and the positive ions are attracted to each other by the electromagnetic force, but they are too energetic to stay fixed together an atom. As a result the free electrons and ions vibrate back and forth. The frequency of vibration depends on the number of free electrons (see Figure 1).
|
|
| Figure 1. Click above for animation showing effects of electron density of vibration frequency. Free electrons are represented in red, ions in blue. Notice the left animation has fewer free electrons and the electrons and ions are vibrating more slowly. |
You may be wondering what all this has to do with HF transmissions. The reason we talk about plasma frequency is because this controls what frequency of EM radiation will be transmitted through a layer. When waves (i.e. photons) of EM radiation pass through free electrons, the electrons respond by moving. The movements of the electrons, in turn generate their own EM field. But if the transmitted frequency is higher than the plasma frequency, then the electrons cannot respond fast enough, and they are not able to generate their own EM. The result is that the original transmitted EM waves can pass right through the electrons unimpeded. However, if the original transmitted EM radiation is at a lower frequency than the plasma frequency, then the energy from the transmitted EM radiation is absorbed by the electrons, causing them to vibrate at that frequency. This causes the generation of new EM waves that are in the opposite (vertical) direction of the original transmission. The effect of the free electrons in this case is to reflect the EM transmission back down toward the surface. Therefore, an important parameter is the maximum plasma frequency, because this is what determines which vertical transmissions will pass through and which will be reflected back. This maximum plasma frequency is called the critical frequency, fo. Because the plasma frequency varies for a given time and location, the critical frequency also varies. However the critical frequency is always within the HF range. This is what gives HF transmissions their unique characteristics.
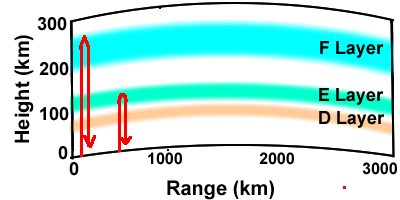
The highest plasma frequency is in the F layer, or more specifically the F2 layer. This critical frequency may be referred to using the symbol foF2. The F1 and E layers also have critical frequencies associated with the maximum plasma frequencies in these respective layers, these are sometimes represented as foF1 and foE. See Figure 2 to see how critical frequencies affect vertical propagation.
 |
|
|
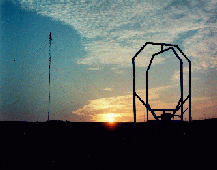
The critical frequencies and other properties of the ionosphere are measured with a device called an ionosonde (Figure 3). An ionosonde works by sending a vertical propagating pulse of EM radiation and measuring the time it takes for the signal to return. The ionosonde will sweep through several frequencies, typically ranging from 0.1 to 30 MHz. Sometimes an ionosonde will have a separated receiver and transmitter transmitter to measure transmissions at different frequencies along an oblique path. |
 |
|
|
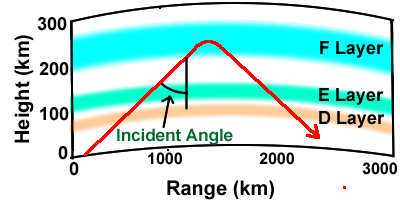
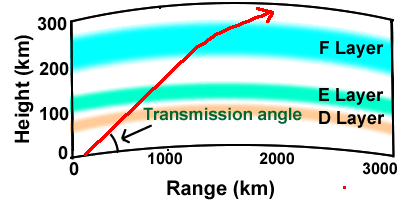
A vertical ionosonde sends and receives signals from the same location. In contrast, most HF transmissions take place between two locations that are separated horizontally. The skywave for these transmission enters the ionosphere at an angle that we call the "incident angle", defined as the angle between the ray direction and vertical (Figure 4). For transmissions that have an incident angle greater than zero (i.e. not vertical), the maximum frequency that causes a transmission to bend back toward the earth is higher than the critical frequency. This is called the maximum usable frequency (MUF). The MUF is proportional to the critical frequency and the secant (equal to 1/cosine ) of the incident angle. Therefore the MUF is higher with a higher critical frequency and with a larger angle from vertical. The largest incident angle and hence greatest MUF comes with the smallest transmission angle, defined as the angle between the earth's surface and the ray at the transmitter (Figure 5). Therefore the maximum MUF occurs for a transmission angle of zero, i.e. when the transmitted ray is horizontal. Due to the curvature of the earth, this ray will eventually reach the ionosphere and be refracted back if its frequency is low enough. Similar to the critical frequency, a MUF can be defined for different layers, so sometimes we speak of the F1 layer MUF and the E layer MUF or EMUF. "MUF" by itself refers to the F2 layer MUF. When a frequency is lower than the E layer MUF, it is refracted at the much lower altitude, see Figure 6. In the previous page we learned that the electron density is higher during the day than at night. Therefore the MUF is higher during the day than at night. The MUF is not significantly affected by transmitter power and receiver sensitivity. |
 |
| Figure 4. Diagram of a ray showing the incident angle and refraction in the F layer. This ray that is at a lower frequency than the F layer MUF, but higher than the E layer MUF. | |
 |
|
| Figure 5. Diagram of a ray showing the transmission angle. This ray is at a higher frequency than the MUF. | |
 |
|
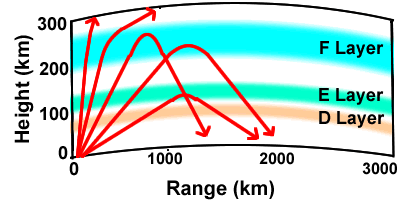
| Figure 6. Diagram showing rays of the same frequency at several different transmission (and incident) angles. The frequency is greater than the critical frequency, next two rays are refracted in the F layer, indicating that the signal frequency is less than the MUF for these angles but greater than the E layer MUF. For the last ray (lowest transmission angle) the E layer MUF is greater than the transmission frequency and the ray is unable to reach the F layer. |
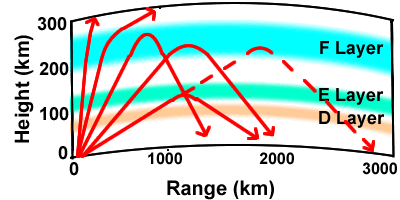
When HF radiation that is refracted back toward the earth reaches the surface, it is reflected back upward at the same angle. This is called a "hop" (Figure 7). The strongest skywave HF signals occur in the region of the first hop. However, if conditions are favorable, for example low frequency transmissions at night with a powerful transmitter and sensitive receiver, there may be a usable signal after several hops. Sometimes transmissions can be received even on the opposite side of earth after many hops. The regions between the hops are called "skip zones". In these regions the signal is weak or nonexistent. Transmissions in the first skip zone (beyond the ground wave coverage) are particularly weak. The higher skip zones may have stronger signals than the first skip zone because rays at different transmission angles tend to spread out and fill in these gaps (not shown).
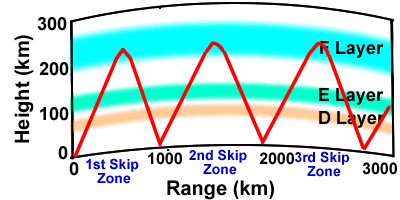 |
Figure 7. Ray diagram showing three hops from one ray. Note the skip zones between the hops. In an actual transmission, there would be rays at different angles which would tend to fill in the higher skips. |
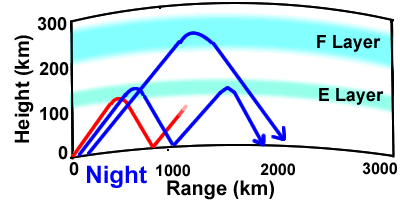
There is a lower limit to the frequency that can be used for skywave propagation during daylight hours. This is called the lowest usable frequency (LUF). This is primarily due to absorption in the D layer, as will now be explained. The D layer contains many more neutral atoms and molecules than higher levels. Previously, we discussed how EM radiation causes free electrons to move. Sometimes the free electrons will collide with the neutral atoms. This causes some of the EM energy to be lost. Lower frequencies have longer wavelengths, which makes the electrons move a greater distance than for higher frequencies, making them more likely to collide with the neutral atoms. Therefore, at frequencies below the LUF the transmission will not reach the receiver (Figure 8.)
 |
|
Above the D layer, there is some absorption, but it is much less than in the D layer because there are fewer neutral atoms. Below the D layer, there are no free electrons to move and therefore absorption is again small. There is some absorption when a ray reflects off the surface. Therefore, the LUF depends on D layer characteristics and how many hops a ray must take before reaching the receiver. During the night, the D layer is not present and so HF transmissions can potentially travel much further distances (Figure 9). Unlike the MUF, the LUF also depends on transmitter power and receiver sensitivity since these factors can overcome some absorption effects.
 |
|
Sometimes a signal will reach the receiver via two or more separate paths (Figure 10). Because this causes the signals to reach the receiver at different times, it can cause signal distortion, fading or beating to occur. This is especially problematic for digital transmissions, because the spreading of the signals in time will decrease the speed with which data can be transmitted. Therefore, transmissions with the lowest possible number of multiple paths are usually best. Typically this is achieved by using a frequency that is near the MUF. Another way to avoid multiple path signals is to use a focused transmission that limits the rays to a small angle range. This requires special antennas.
 |
|
|
|
We have seen how HF transmissions are strongly affected by which particular frequency is used. We want to choose a frequency that will allow refractions, i.e. is below the MUF, but will not be absorbed in the D layer, i.e. above the LUF (Figure 11). Usually the best choice for long range communication is to use the highest frequency that will still be refracted in the F layer, i.e. near the MUF. This minimizes D Layer absorption (during the day) and allows the fewest number of hops and less likelihood for multiple path signals. However the determination of the MUF is an inexact science and there are short term changes in the ionosphere that change the MUF. For these reasons, if the frequency chosen is right at the MUF, it will be successful only 50% of the time and fadeouts are likely. Therefore it is better to chose a frequency a little below the MUF. HF users have found that using a frequency that is the MUF times 0.85 gives the best chance for good results. This is called the frequency of optimum transmission (FOT).
Usually the FOT is a good choice for HF communications, but not always. For example, for communications at ranges less than 2000 km, it is often better to choose a frequency that is lower that the E layer MUF, which is usually below the FOT. This is because these ranges are often in the skip zone for typical F layer hops (Figure 11). In other situations, the LUF might be higher than the FOT, for example for very long range or weak transmissions or when a space weather event (discussed in a following page) increases the D layer electron density. In these situations, it is better to choose a frequency higher than the FOT.
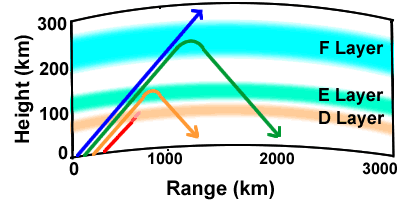 |
| Figure 11. Ray diagram showing the effect of using different frequencies at the same transmission angle. The blue ray frequency is greater than the MUF and passes into space. The green ray frequency is less than the MUF but greater than the E layer MUF. This is usually the best frequency region to use for long range communications and is usually where the FOT (equal to 0.85 x MUF) exists. The orange ray frequency is less than the E layer MUF and greater than the LUF. This is best for medium range (around 500 to 1500 km) transmissions. The red ray is less than the LUF and is absorbed in the D layer. |
You have been provided a great deal of information in this module concerning how HF transmissions depend on the frequency that is used. You can see it is a complicated problem. The best frequency to use depends on the range, the time of day, the transmission angle and other factors. Even the most experienced HF users can't possibly calculate all these factors in their head. To optimize HF frequencies you must rely on some type of model. There are two general methods that can be utilized for obtaining model results on HF propagation:
- Computer models that you run locally.
- Computer model results that are available on the Internet.
There are several HF models in use to do predictions that work by specifying locations for a transmitter and receiver, and a date and time. One that is widely used by ham radio operators as well as by the Navy is called VOACAP, the Voice of America Coverage Analysis Program, originally developed to predict radio coverage for the Voice of America radio programs, and acknowledged to be the best HF prediction model in use today. For more information on this model, and to run a user-friendly online version of this model, please see http://www.voacap.com/prediction.html.
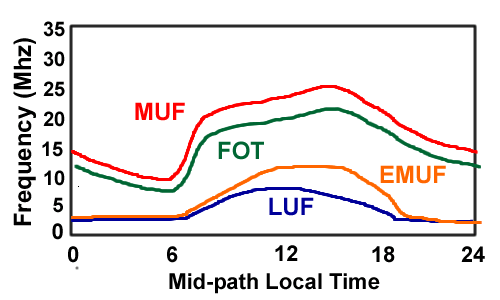
Most HF propagation models produce a chart similar to Figure 12 except the models show Universal Time instead of Local Time. This shows a typical diurnal change in various frequencies for a mid-latitude location. Note the rapid increase in all the frequencies when the sun rises at about 0600 local time and the more gradual decrease when the sun sets around 1800 local time. This diagram is typical for a favorable situation with no strong space weather events, a moderate range (2,000 to 4,000 km) and a powerful (5,000 Watt) transmitter. With a longer range or weaker transmitter, the LUF will be higher and may even cross the MUF, the result being that no signals will be transmitted.
 |
|
The primary ionospheric characteristic that controls HF propagation is the electron density. This determines which frequencies will pass through a particular layer and which will be refracted back downward. For vertically-propagating waves the frequency below which radiation is refracted back down is called the critical frequency. The critical frequency depends on the time of day, the latitude, season and space weather (the latter to be discussed later). For horizontal transmissions, the equivalent parameter is the maximum usable frequency (MUF). The path of HF radiation can take several hops before reaching the receiver, creating skip zones between the hops. Several factors can degrade the HF signals. One of these is D layer absorption which occurs during the day. This absorption is stronger for lower frequencies, resulting in what is called the lowest usable frequency (LUF). Multiple paths can also degrade signals. In many situations the best frequency to use is the near the value of MUF times 0.85. This is called the frequency of optimal transmission (FOT). You may see different acronyms and terms used for these concepts. The concepts introduced in this page should help you use and interpret the results of HF prediction models to determine the best frequency to use for a particular situation.
1. How is the critical frequency related to the plasma frequency?
2. How is the maximum usable frequency (MUF) related to the critical frequency?
3. What is the difference between MUF and EMUF?
4. How can HF travel such long distances?
5. What controls the value of the lowest usable frequency (LUF)?
6. What causes multiple paths?
7. What is definition of the frequency of optimum transmission (FOT)?
8. In what situations would you not want to use the FOT?