At the end of this module, you should be able to:
|
Click on this radio to view an animation that demonstrates the principles we will discuss below. Keep the new window open while you read the rest of this page. You may need to undock the new browser tab or rearrange the windows to see everything. |
Transmitter
The animation you see is a simplified representation of how radios work. Sound
waves from the woman's voice on the left are converted to electric signals by
the microphone. A modulator converts the relatively slow sound wave frequency
of the electrons into much higher frequency EM waves that carry the sound signal
by small changes in frequency (frequency modulation, or "FM" for short) or changes in amplitude (amplitude modulation, or "AM").
The amplifier boosts the voltage to a transmission level.
Antenna
The electronic pulses travel to the transmitting antenna where electrons move
back in forth in response the varying voltage. These accelerating electrons
generate EM radiation. This simple rod antenna is an omni-directional. This
type of antenna causes radiation to be transmitted in all horizontal directions,
but above and below the horizontal plane bisected by the antenna the strength
of the radiation signal decreases. Other types of antennas will create different
radiation patterns. For example most radars produces relatively narrow beams.
If there is nothing that interacts with the waves, for example in empty outer
space, the waves will decrease in strength away from the transmitting antenna.
The strength of the EM signal is 1/r2 where r is the distance from
the transmitter. This normal decrease in power away from the antenna is called
r-squared loss.
Receiver
Electrons in the receiving antenna move up and down in response to
the EM radiation and generate a small voltage which drives an electric current.
This voltage is amplified and demodulated into a voltage that varies at the
original sound frequencies. The current produced then drives a speaker that
produces sound waves that reproduce the women's original words and can be heard
by the man.
We can't see most EM waves, but we want to be able to represent them graphically in order to demonstrate how they propagate in the atmosphere. In this module we will use four display methods, all of which are demonstrated in the radio animation.
| Wave Display | 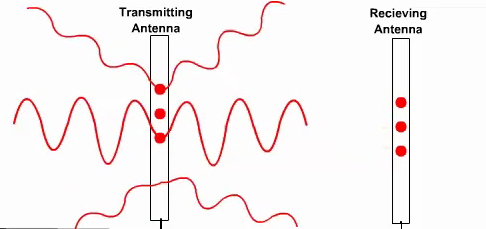 |
This display shows wiggly lines that represent
the EM waves. The distance from the peak of the waves to the valley of the
waves is called the amplitude. Sometimes the amplitude is used to display
the EM signal strength, i.e. the maximum strength of the varying electric
and magnetic fields. In the animation, notice how the amplitude is less for the
waves traveling above and below the horizontal plane representing the weaker
signal strength in these areas. The r-squared loss is not shown.
The wavelength is represented by the distance between
wave peaks (or valleys). Usually it is not practical to represent the
actual wavelength or a correct wavelength scaled to diagram because it is
too large or too small. Although actual EM radiation has both electric and
magnetic fields, wave displays typically show only the electric field. |
| Phase Display | 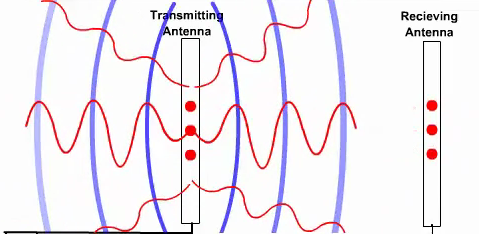 |
The phase display in the animation shows lines that connect all the wave peaks.
These are called phase lines. This type of display is useful for showing
how radiation spreads out from a source and how reflected and direct path
waves interact. The distance between the phase lines can indicate wavelength
or frequency. A disadvantage to this display method is that it does not usually
give an indication of signal strength. In some cases, we indicate a decrease
in signal strength by making the phase lines duller. |
| Ray Trace Display |
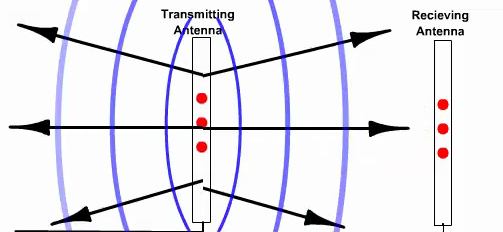 |
Lines drawn at right angles to phase lines are called ray traces.
Ray traces can be thought of as photon paths and indicate
direction of EM energy transmission. Ray traces are a simple way to show how
radiation reflects or curves as it propagates. Often we show multiple rays
representing radiation propagating at different angles from the same antenna.
Sometimes the distance between rays can be used as qualitative measure of
signal strength (e.g. when rays converge due to some focusing mechanism).
However if converging rays are out-of-phase, the result can be a decrease
in signal strength. This points out a disadvantage to ray traces -- they do
not show phase relationships and cannot show a quantitative signal strength.
Representations of high frequency (HF) and optical radiation typically use
ray traces. (The black line with an arrow in Figure 4 on the previous page
is a ray trace.) Note that the electric and magnetic force lines in EM radiation
are always at right angles to the ray traces (and each other). |
| Signal Strength Display |
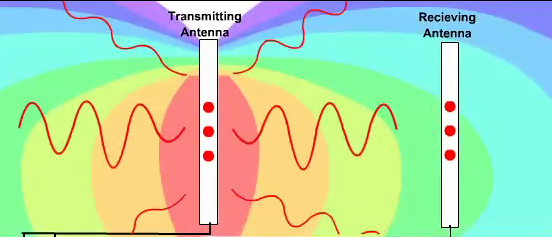 |
This method shows the EM signal strength by using contours or colored ranges. This is the most quantitative display method and is used by the Advanced Refractive Effects Prediction System (AREPS) and most other UHF and VHF prediction tools. This is the only method that can accurately show subtle details of how signal strength varies in space. Although this type of display cannot directly show phase relationships and reflections, it is especially good for displaying the resulting signal strength interference patterns from such effects. In the animation, the greatest signal strength is indicated by red with yellow, green, blue and purple, respectively, indicating. Note how the signal strength shows both r-squared loss and a weakened signal above and below the transmitter level. |
Accelerating charges, such as the electrons in an antenna, generate EM waves. These waves propagate through the atmosphere and accelerate other electrons in a receiving antenna, allowing the transmission of voice and data. There are four common ways that the EM waves can be visualized: wave display, phase display, ray traces and signal strength displays.