LES preliminary results
Here are the results of two simulations performed by the
Large-Eddy Simulation (LES).
They are presented as animations under mpeg (compact but poor
quality and no frame rate control) or gif format (larger, but
good quality at 6 fps).
Common features to both simulations
Both simulations include cabelling and thermobaricity in
the equation of state. The time step is 6s and the resolution
is 6.25x6.25x5.93m. The box has 64x64x64 grid points.
The bottom boundary condition is slip, well below the initial
mixed layer. The surface boundary is slip, with a rigid lid and
an ice cover.
The model is initialized with one of the least thermobarically
stable profile measured near Maud Rise at yo-yo
cast YUO75 of the 1994 ANZFLUX Weddell Sea project,
the object being to reproduce the 1-D model results of
McPhee (2000) . This profile shows a 3-layer system,
with 2 interfaces at 100m and 200m depth (fig.6 of the article).
Problems with initial stability of the initial profile in McPhee (2000)
led us to shift the salinity profile by 1m downwards. This removed the
density inversion at 100m, and produced an agreement between the
T-S characteristics of this profile and those also measured in this
area by Stanton (personal communication).
A thermodynamic ice model has been implemented at the
surface, based on the model described by
McPhee (1990).
Heat, salinity and momentum fluxes are calculated from
u* deduced from ANZFLUX measurements, along with the
evolution of ice thickness due to freezing and melting.
Simulation 1
This simulation, like four other variants which applied a
momentum flux at the surface, grew to be too warm in the
upper layer, but still showed interesting patterns. This
version is not as bad as the others because the 'Stanton'
number c_h used to determine heat flux is adjusted so that
delta-T is between the bottom of the ice and the average of
the uppermost model grid, rather than the average mixed layer
temperature. Simulation 2 below also uses this augmented
coefficient (about 1.4x for our dz), which is recalculated
by assuming a log profile of the temperature just below the ice.
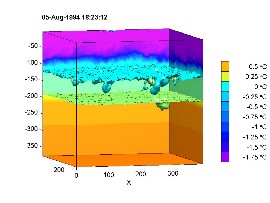
Potential temperature is shown on 2 vertical sections, and
interfaces are characterized by 2 isothermal surfaces at 0°C
(above) and 0.18°C (below). The shear stress driven by
surface momentum flux feeds the growth of large internal waves
at the first interface which in turn leads to excessive vertical
mixing. We believe the most likely solution to this divergence
between model and observations is either that the non-slip surface
where the momentum flux is uniformly applied does not adequately
dissipate the internal wave motions, or that the profile from
YU075 cannot be used to uniformly initialize the water column.
We are currently reworking this upper boundary condition, but
in the meantime we offer a less realistic simulation below which
sidesteps this problem.
MPEG#1 (256 Kb)
GIF#1 (11.8 MB)
Simulation 2
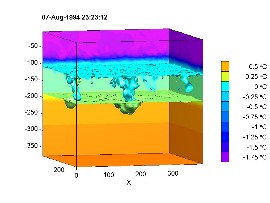
In this simulation, no momentum flux is transferred into the mixed
layer. This is not realistic, but it was easier than altering the
slip surface boundary condition.
Again, potential temperature is shown on 2 vertical sections, and
interfaces are characterized by the isothermal surfaces at 0°C
(above) and 0.18°C (below). This simulation was numerically
stable, and convective plumes hit the bottom of the modelled box
after 7.5 simulated days.
MPEG#2 (468 Kb)
GIF#2 (17.2 Mb)