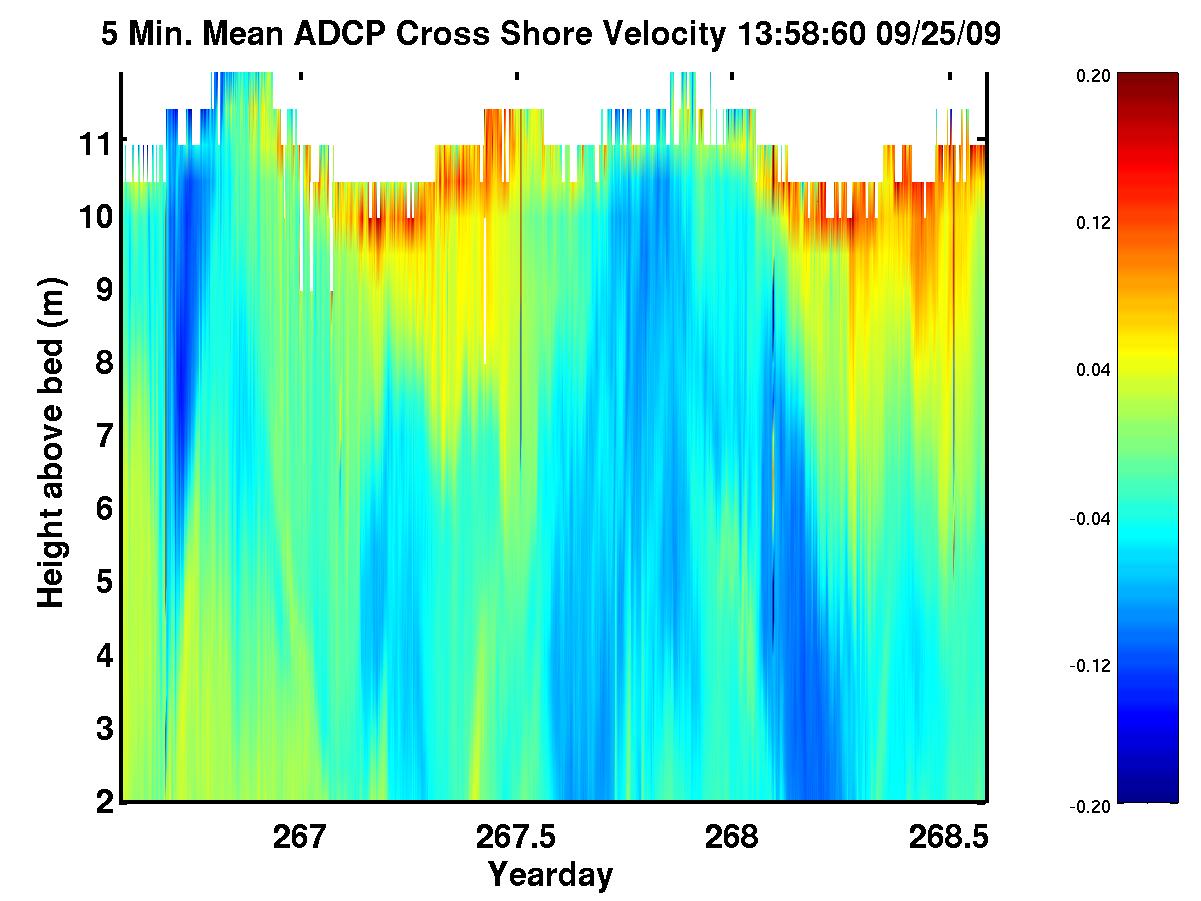
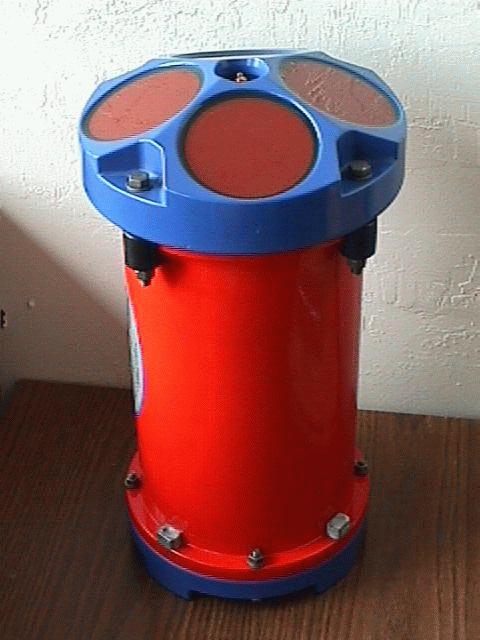
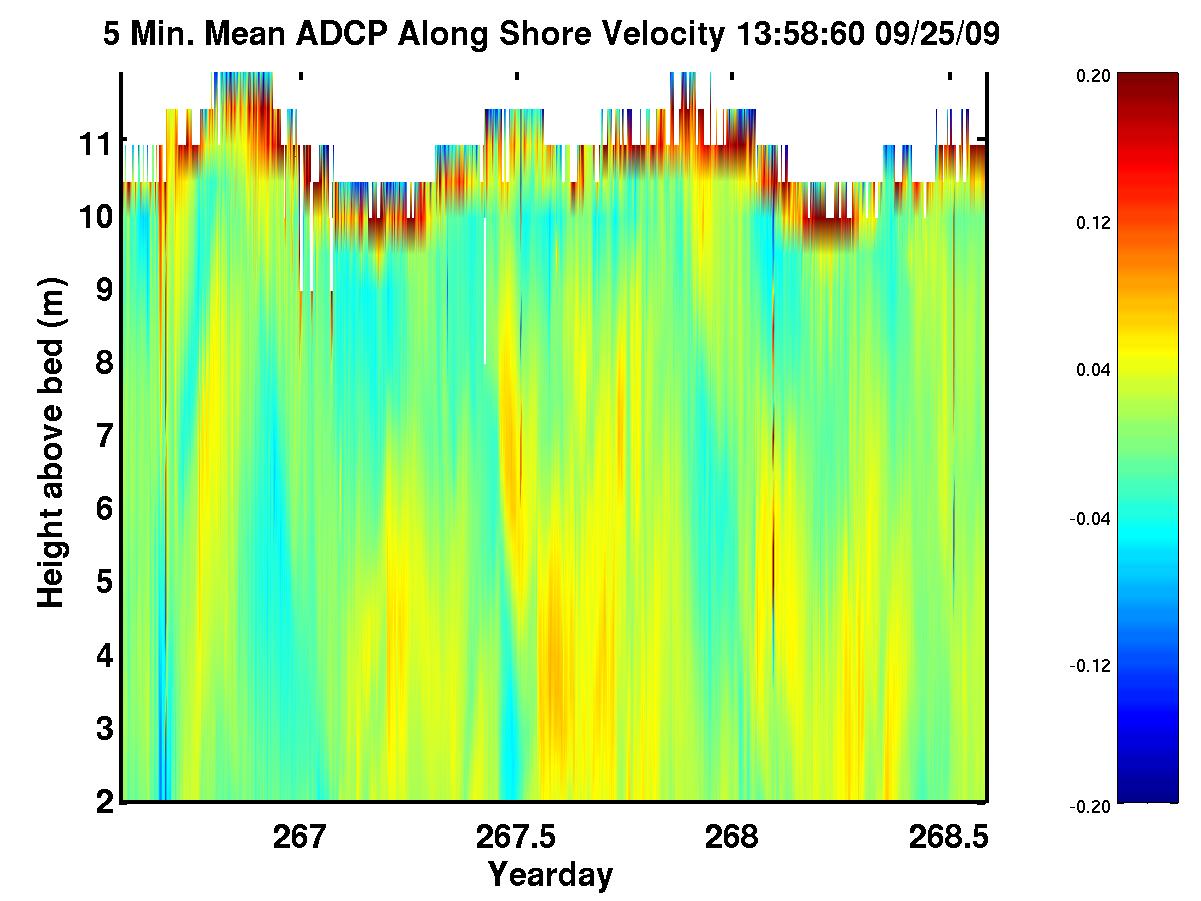
Vertical profiles of currents from 12m depth to surface are made with this acoustic doppler current profiler mounted on the 1m high instrument frame. Current vectors (cross-shore and along-shore components) are measured every 0.5m up to the surface. A two day timeseries of the most recent current components is shown in the color contour plots below. These data have been averaged to 5 minute intervals to remove variations caused by waves. The blue to red color scale corresponds to a -0.2 to +0.2 m/s magnitude (Note that this is double the range of the MISO ADCP 5-minute mean plot). If the currents are moving uniformly through the water column, these timeseries appear as vertical stripes, whereas current gradients, or vertical shear, have color changes in the vertical. The upper 1 to 2 bins of data from the instrument is contaminated by an acoustic reflection from the water surface. The sinusoidal shape results from tidal water depth variations. The time axis is yeardays, where yearday 1.000 is the start of 1 January.
Please note, all times displayed here are Universal Time (UT), and plots are updated hourly.
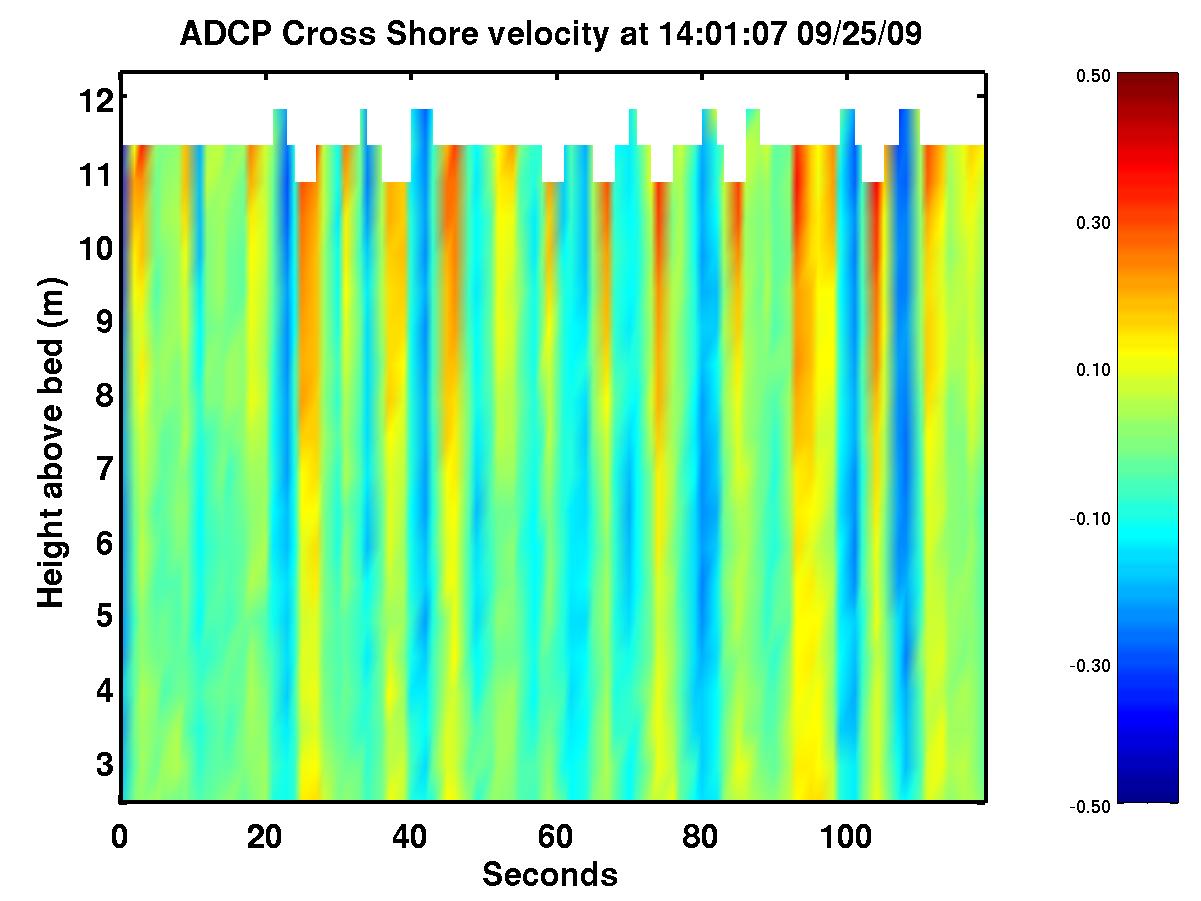
The current data below was also collected by the same
acoustic doppler current profiler
noted above. This 2 minute timeseries shows currents at the original 1
sample per second data rate, representing wave velocities. Here the
velocity range has been expanded so that the blue to red color scale
corresponds to a -0.5 to +0.5 m/s magnitude.
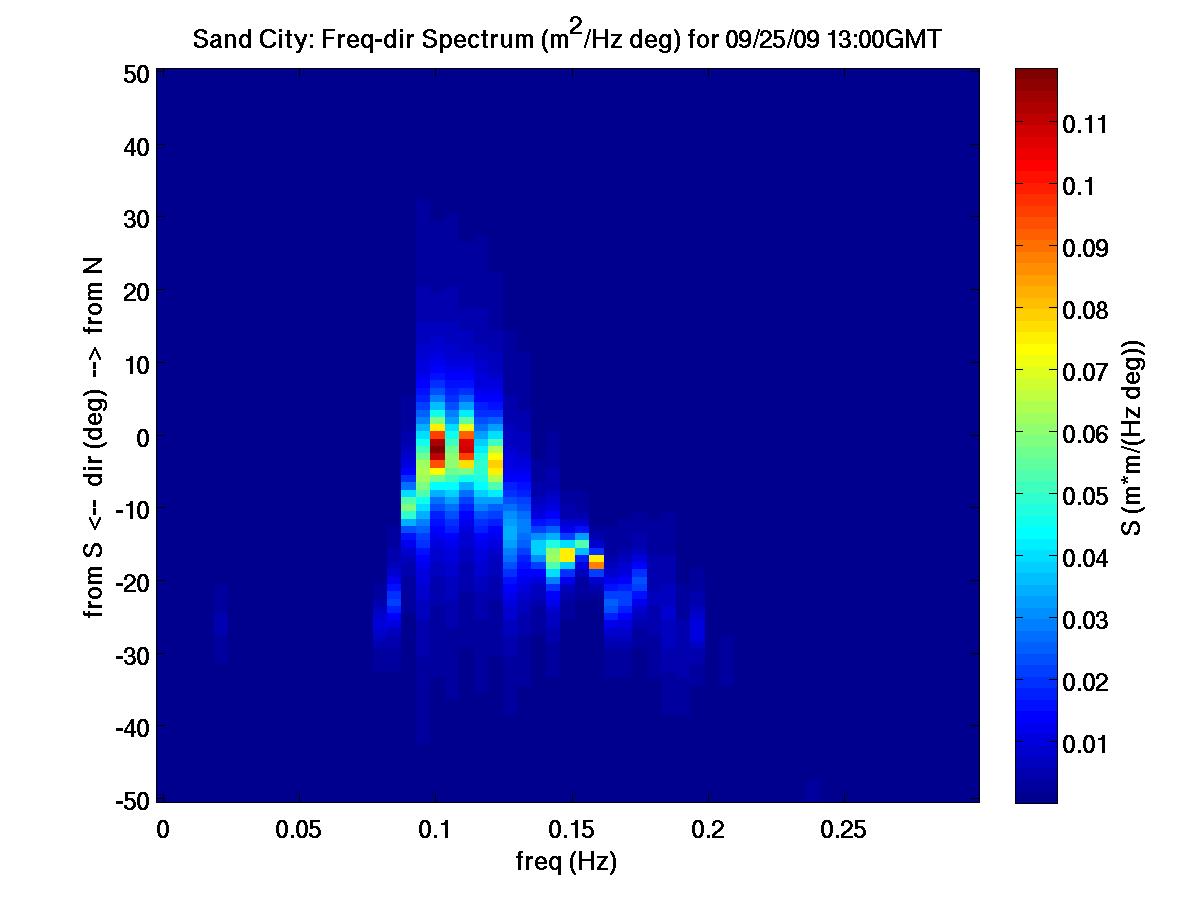
The spectrum shown below was calculated using the Maximum Entropy
Method with sixty minutes of P,U, and V data. It has a frequency
resolution of 0.005Hz, directional resolution of 1 degree, and
approximately 35 degrees of freedom.
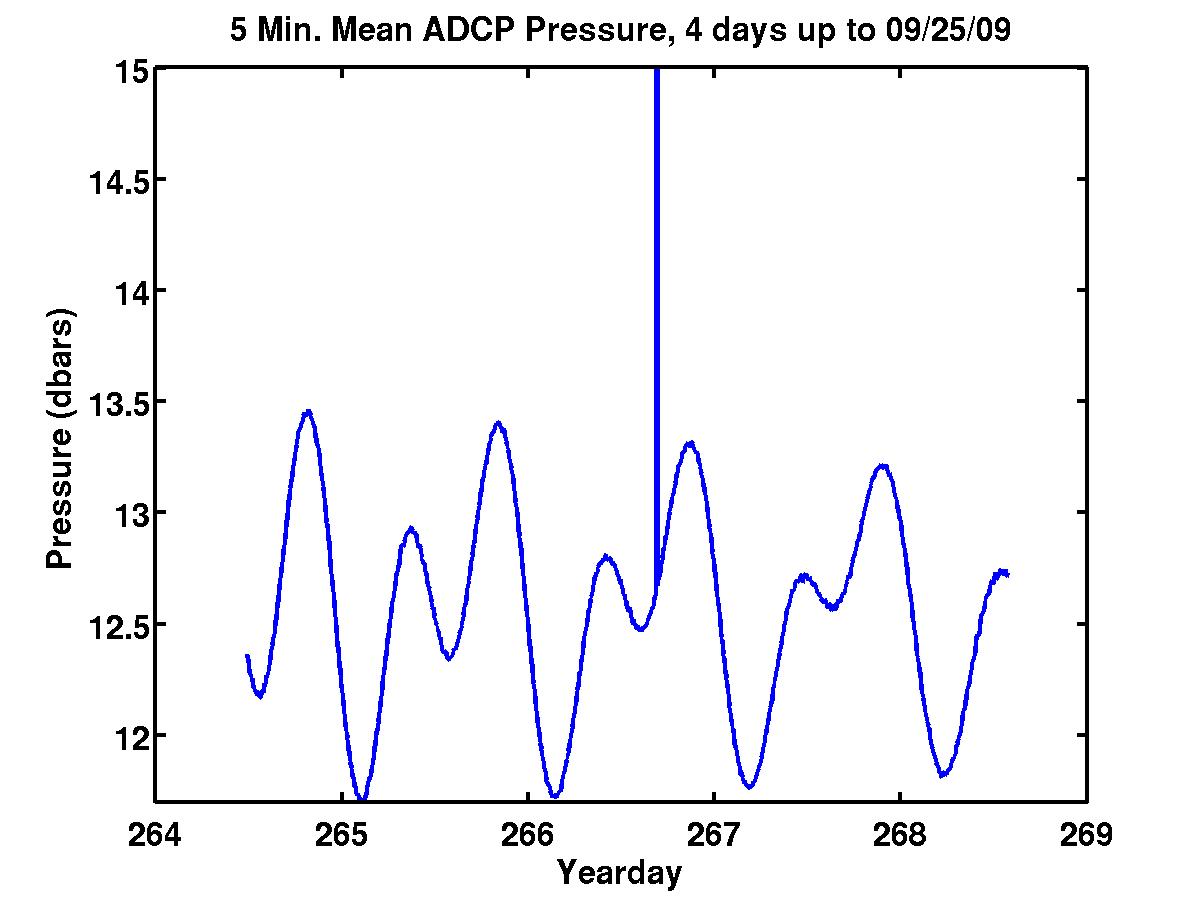
The
acoustic doppler current profiler records pressure in decibars, one
sample every 30 seconds. This timeseries shows 5-minute meaned
pressure values recorded over the most recent 4 days.