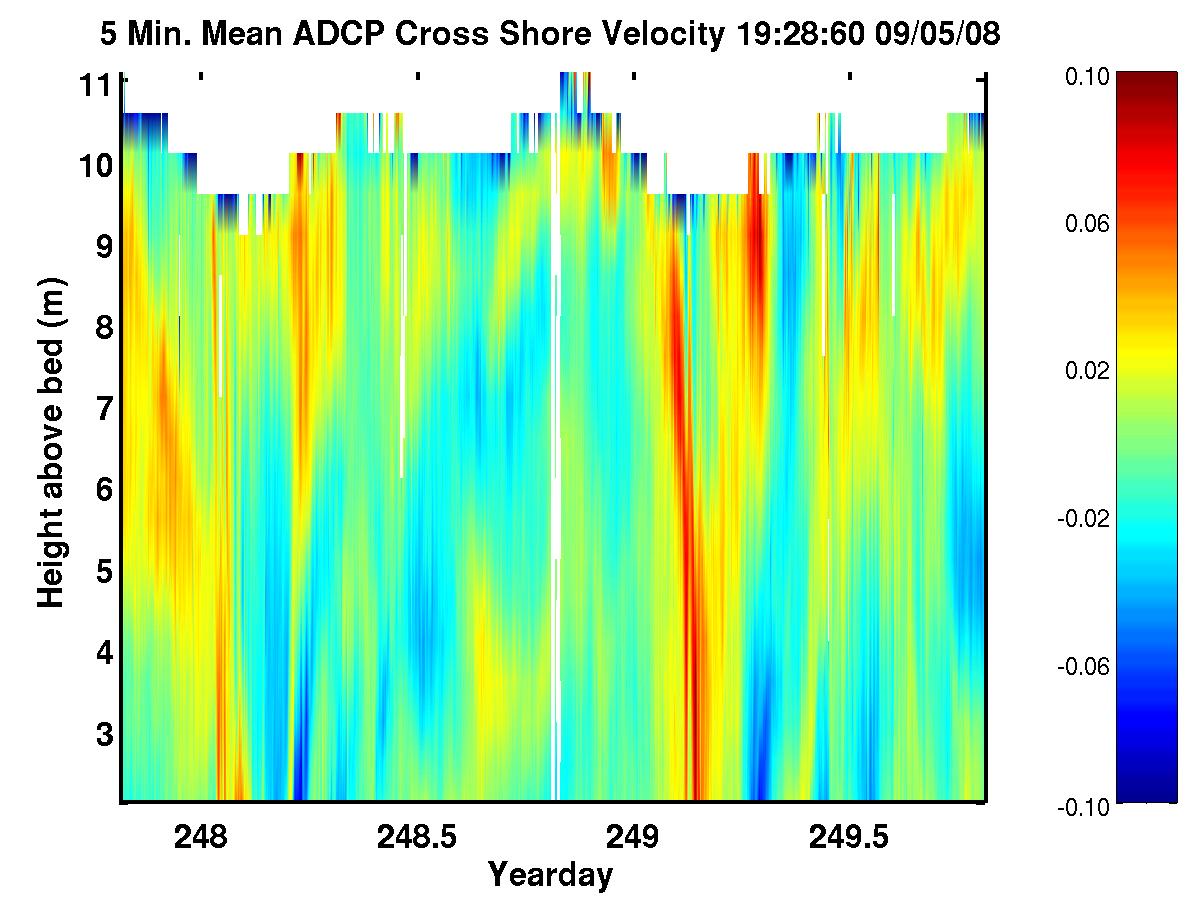
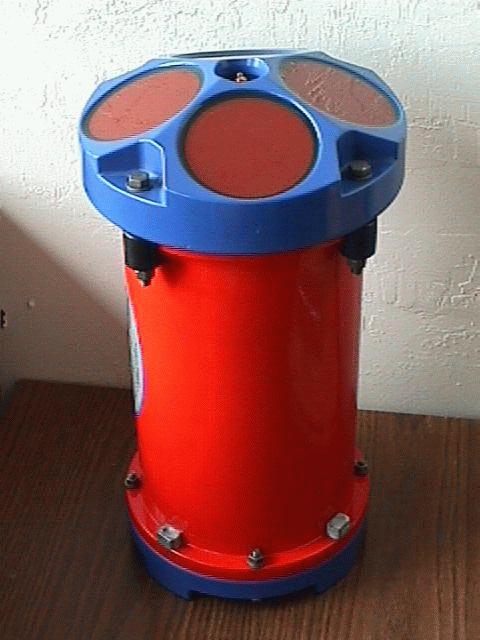
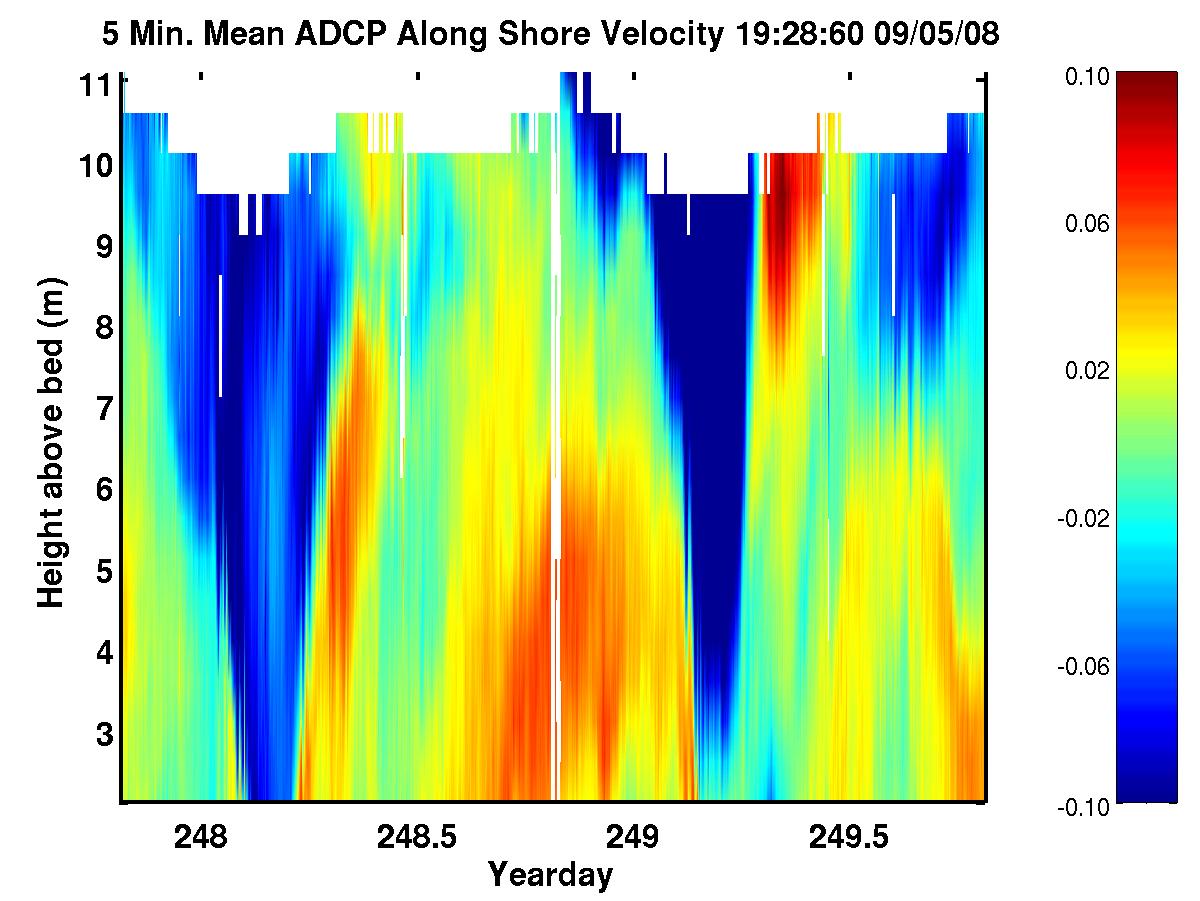
Vertical profiles of currents above the 12m depth instrument array are made with an acoustic doppler current profiler mounted on the 1m high instrument frame. Current vectors (cross-shore and along-shore components) are measured every 1m up to the surface. A two day timeseries of the most recent current components are shown in the color contour plots below. These data have been averaged to 5 minute intervals to remove variations caused by waves. The blue to red color scale corresponds to a -0.1 to +0.1 m/s magnitude. If the currents are moving uniformly through the water column, these timeseries appear as vertical stripes, whereas current gradients, or vertical shear, have color changes in the vertical. The upper 1 to 2 bins of data from the instrument is contaminated by an acoustic reflection from the water surface. The sinussoidal shape results from tidal water depth variations. The time axis is yeardays, where yearday 1.000 is the start of 1 January.
Please note, all times displayed here are Universal Time (UT).
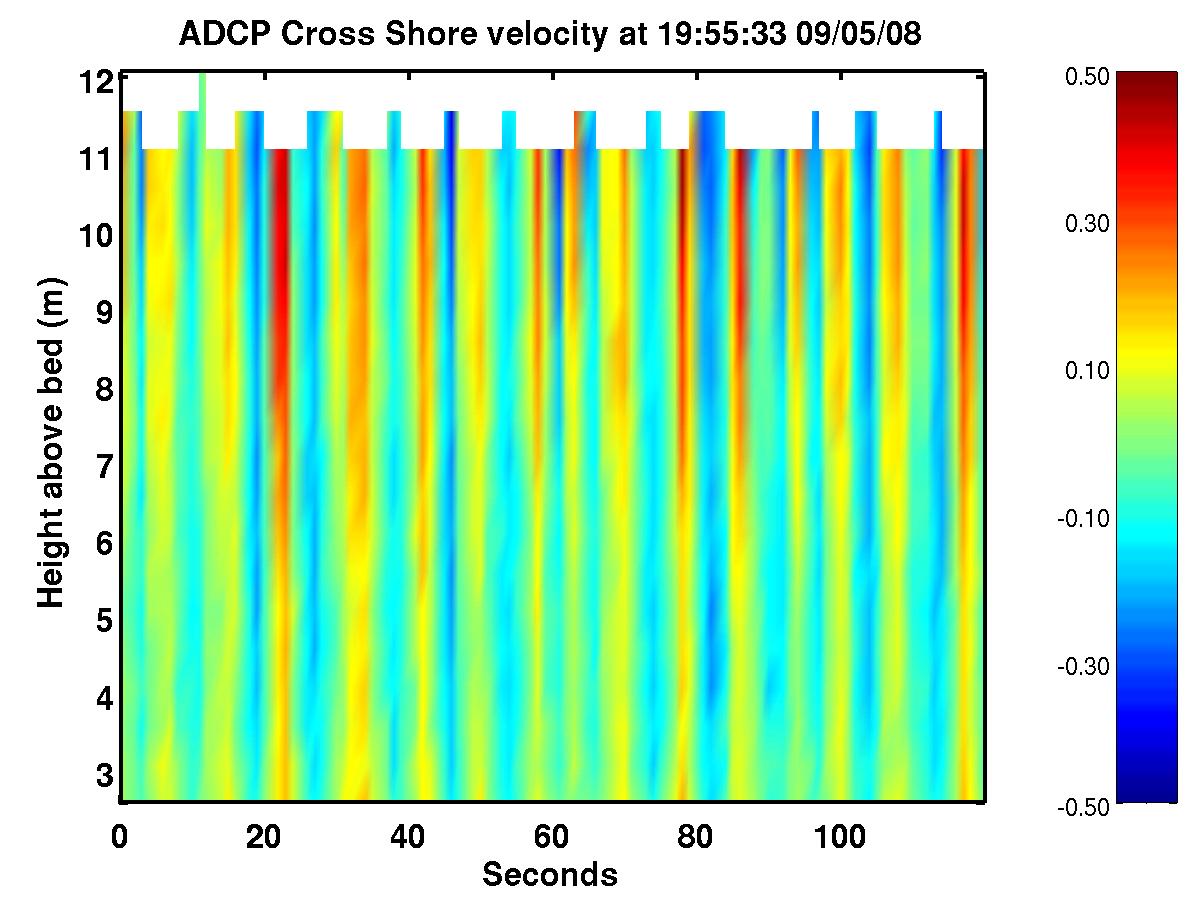
The current data below was also collected by the same
acoustic doppler current profiler
noted above. This 2 minute timeseries shows currents at the original 1
sample per second data rate, representing wave velocites. Here the
velocity range has been expanded so that the blue to red color scale
corresponds to a -0.5 to +0.5 m/s magnitude.
The following plots show historical data from the summer of 1999. In these plots, most of the time there are small but significant changes in current speed through the water column. If the water column is well mixed, these vertical gradients are small, and result from the formation of an Ekman layer. However, the water column at this time had density gradients from vertical differences in temperature and salinity. A stratified water column supports internal waves (seen for example, at the start of yearday 223), and allows strong shear layers to form when the water column is stressed by wind forcing. Solitary internal waves or solitons are highly nonlinear disturbances in the water column which frequently propagate inshore producing long-crested bands of rough and calm water in coastal regions. These processes act together to produce a complicated, time varying current profile in coastal waters. The MPEG animation at the end of this page (size 1.68MB) can be uploaded if your browser supports this feature. It shows a time-sequence of the changing current structure over a four day period starting on yearday 220.
![[Image of Color Contour of U]](ucurr222.jpg)
![[Image of Color Contour of V]](vcurr222.jpg)
Material contained herein is made available for the purpose of peer review and discussion and does not necessarily reflect the the views of the Department of the Navy or the Department of Defense.