A twenty day subset of the sand camera and structured light data was analyzed by Lt. Damon Dixon for his MS thesis. The cross-shore light stripe generated by a laser light source was converted to a timeseries of cross-shore bed height profiles.
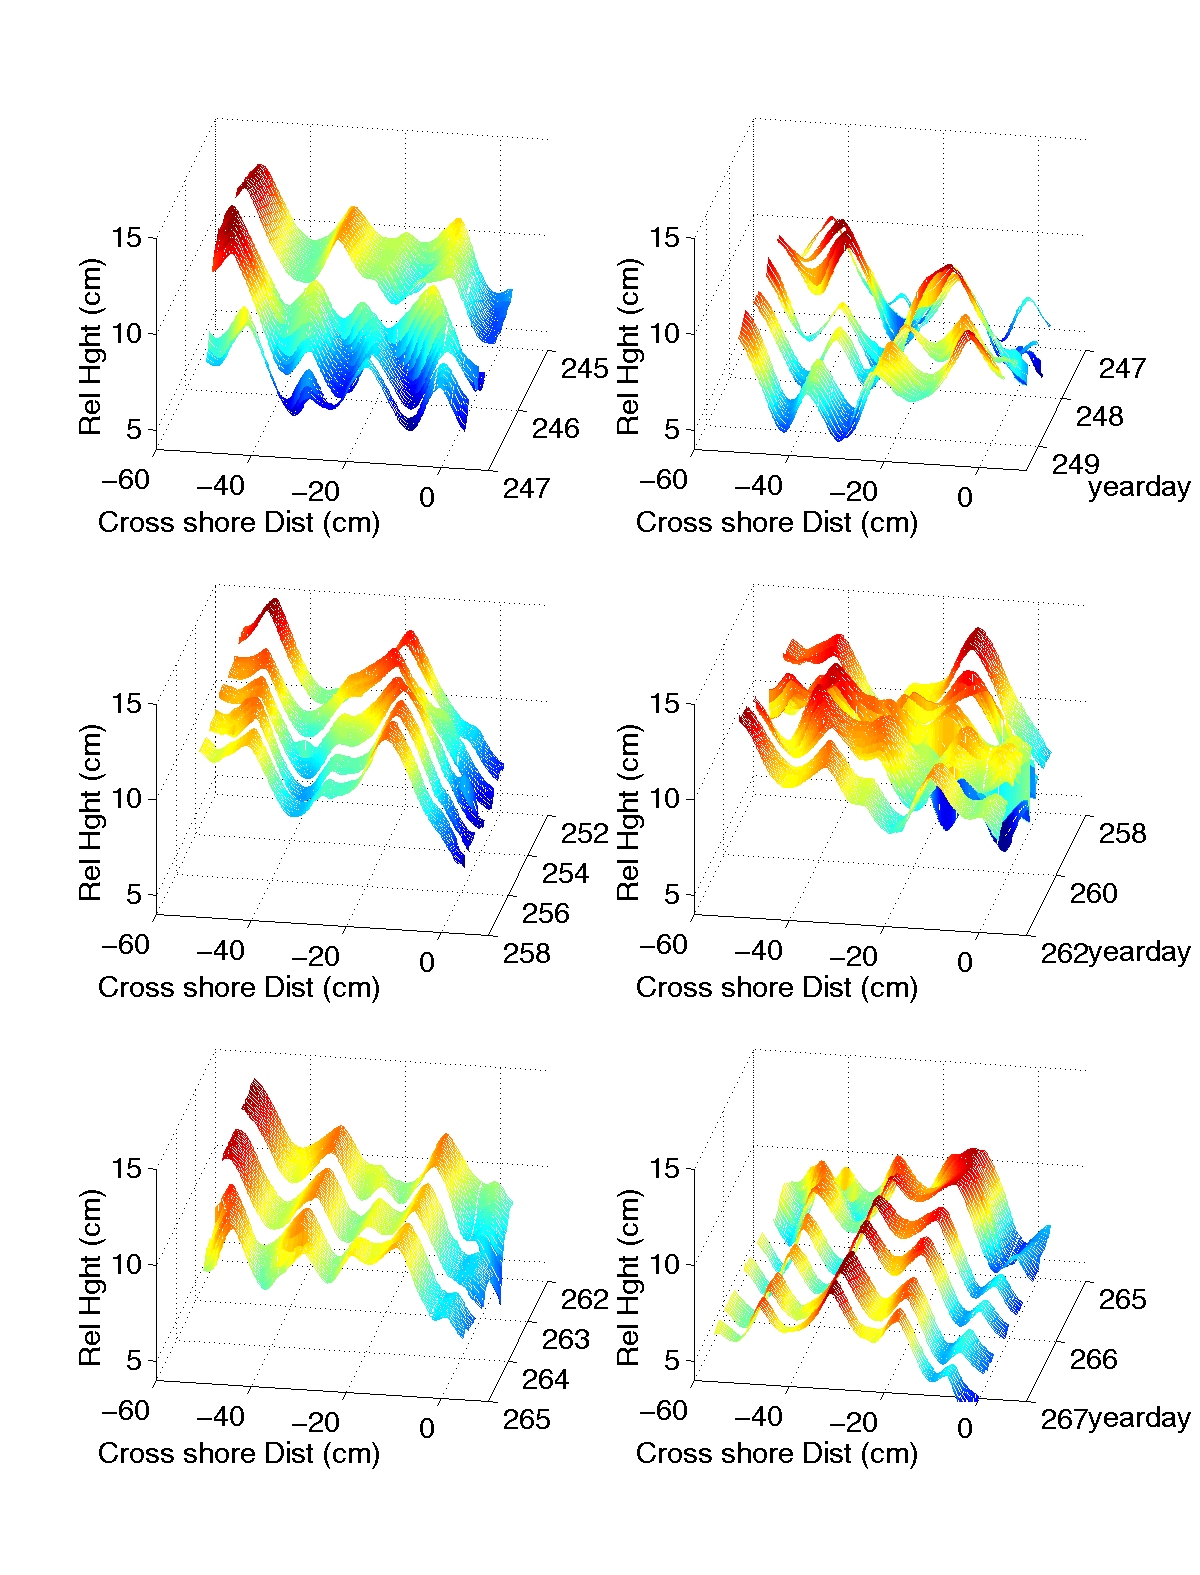
This first figure sumarizes the bed evolution during the measurment period.
Each of the six panels shows a 3-6 day period of relative ripple height (cm) vs.
cross-shore distance (cm). Offshore =0 while onshore =-60. Red and yellow outline
ripple crests while blue and light green represent ripple troughs. The key feature to
notice is the evolution from long crested ripples (yearday 252-258) to shorter
crested bifurcated ripples (yeardays 260-263).
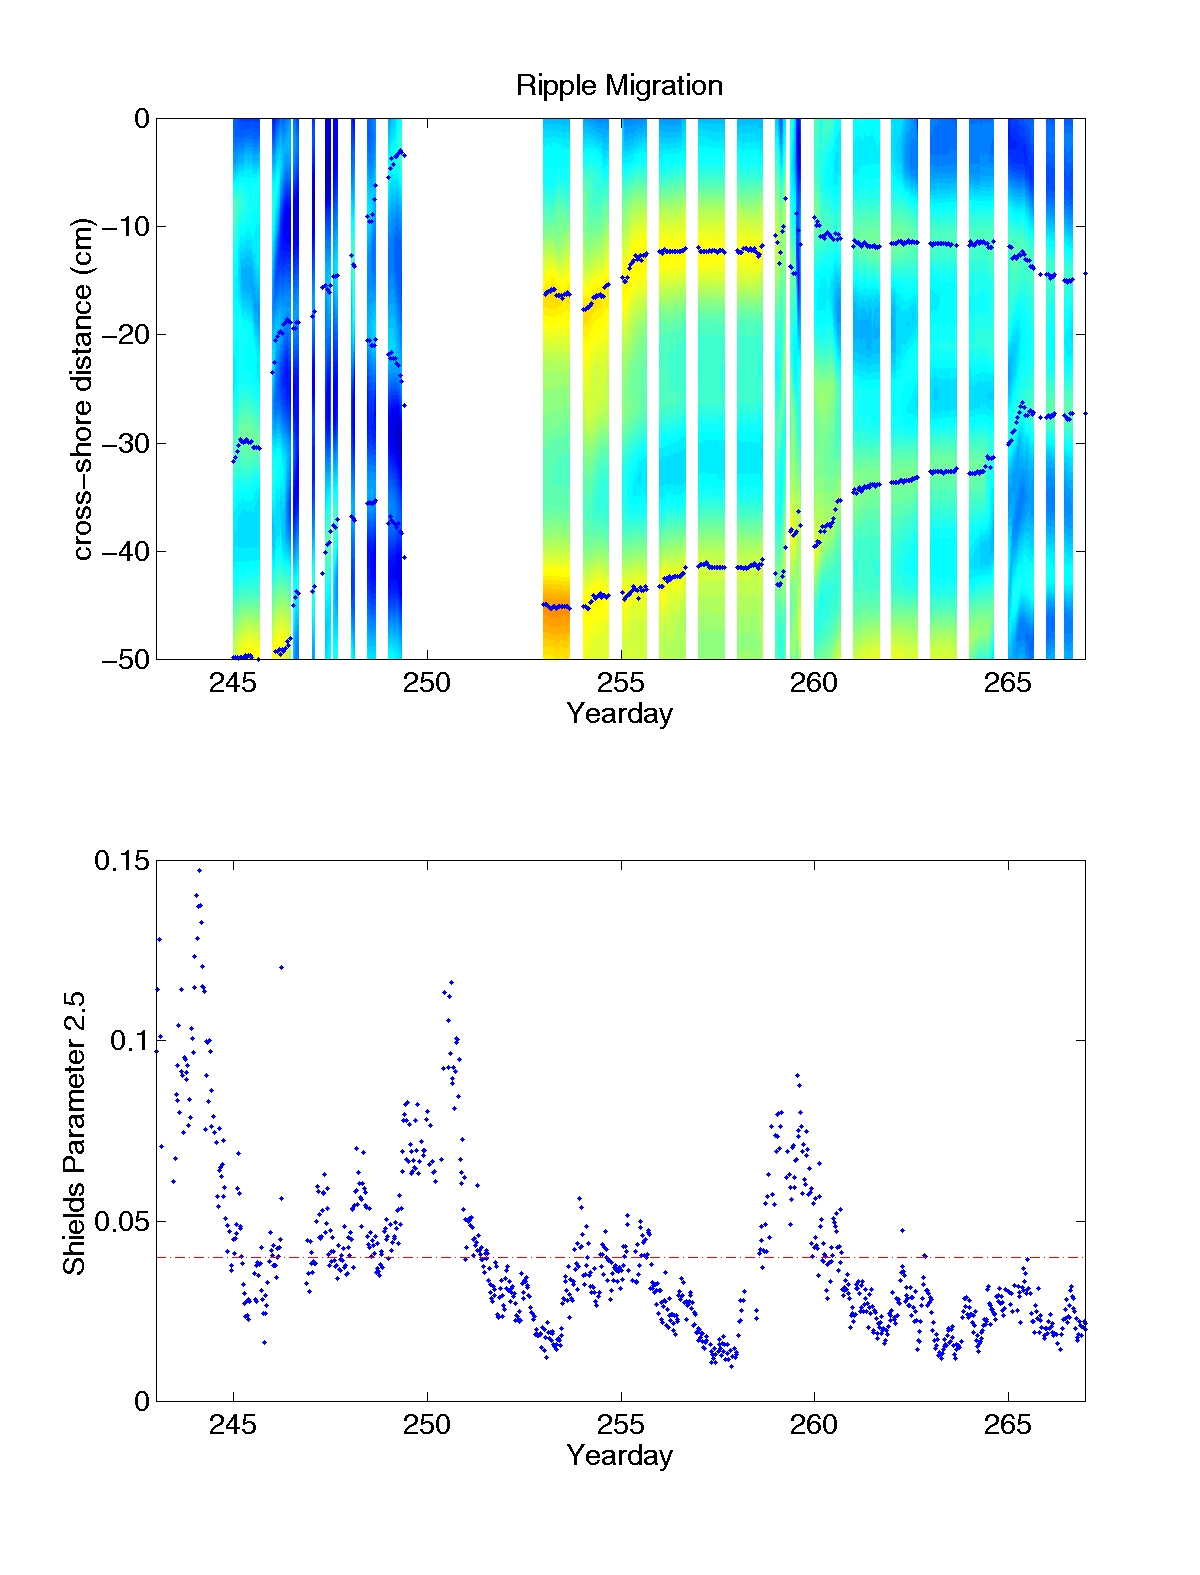
The following figure shows two ripple crests movement vs. time in the top panel.
The y-axis is cross-shore distance oriented such that the offshore direction =0 cm and
the onshore direction =-50 cm. The Shields parameter plotted vs time in the bottom
panel. Bigger waves result in strong bed orbital velocity. It is during these
times, that the ripples migrate. Migration is predominantly offshore, except
during yearday 249, where the top ripple crest bifurcates resulting in a crest
that continues to migrate offshore and the separting crest to migrate onshore.
Material contained herein is made available for the purpose of peer review and discussion and does not necessarily reflect the the views of the Department of the Navy or the Department of Defense.