Rip Currents: A Field Experiment and Numerical Model
1. BACKGROUND
1.1 Motivation
Rip
currents are approximately shore normal seaward directed flows that typically
reach speeds up to 1 m/s, and have been reported as high as 2 m/s in mega-rips
such as at Palm Beach, Australia [Short, 1985]. Rip currents are the most
visible feature of nearshore circulation systems, often identified by sediments
being carried offshore (see Figure 1, showing the experiment site). Rip
currents generally form when waves approach normal to the shoreline or at a
slight angle. However, if the angle is too great, the tendency for rip currents
to form diminishes. Rip currents return the water transported shoreward by
waves and, under certain conditions of nearshore slope and wave activity, rip
currents are the primary agent for the seaward transport of water and
sediments. Rip currents are usually narrow (10-20 m in the alongshore
direction) and generally span the entire water column, however, offshore of the
surf zone they tend to be confined near the surface (Shepard et al., 1941).
Interest in studying rip currents is motivated by their importance to nearshore
processes such as offshore sediment transport, shoreline evolution, and
pollutant transport. Public interest in
rip currents is due to beach safety issues and beach erosion (Short, 1985).

Figure 1. Photograph of experiment site for RIPEX at
Sand City, California. Rip currents are
clearly visible owing to quasi-periodic holes (approximately 100 m apart) in
the alongshore bar.
Owing to
the complexities of the nearshore, previous comprehensive nearshore experiments
have been conducted on beaches with simple morphology (near planar beaches
during NSTS at La Jolla and Santa Barbara, California, and a simple linear bar
at Duck, North Carolina). A Nearshore Research Workshop was conducted to assess
areas of important research needs (Thornton et al. 2000). A recommendation of
the workshop was that there is a need to conduct experiments on 3-D beaches
where processes depend strongly on the local bathymetry in order to understand
processes and to provide data for the testing of numerical models.
The objective of this research is to comprehensively measure in the
field and numerically model a rip current system. The approach is to expand and
leverage a currently funded ONR-funded steep beach dynamics experiment in
Monterey Bay, providing an exciting opportunity to obtain detailed quantitative
measurement of a rip system for the first time. The observations will include
an array of current meters and pressure sensors to measure currents, cross and
long-shore pressure gradients to resolve wave-induced dynamic forcing,
infragravity and shear instabilities of the longshore current, vertical
velocity profiles of the rip current, video imaging of the wave and current
fields, and rapid surveys of bathymetry and current profiles.
1.2 Past Observations
Field
measurements of rip currents for the most part are based on visual
observations, which introduce a high level of subjectivity to the data analysis
and subsequent conclusions. Shepard et al. (1941) found that the intensity and
the distance the rip currents extended seaward increased with increased wave
height. Shepard and Inman (1950) found
the magnitudes of flow velocities within the rip currents are directly related
to the incident wave heights. McKenzie
(1958) found that rips were few in number but strong during high-energy wave
conditions, while under mild wave conditions, rips were weaker but more
numerous leading to smaller rip spacing. Short (1985) acquired almost two years
data on rip currents at Narrabeen Beach, Australia. His analysis along with the
work of Huntley and Short (1992) obtained relationships between rip spacing and
persistence based on breaking wave height, direction and period. An improvement
to visual observations of nearshore processes is the application of time lapse
video. Ranasinghe et al. (2000)
analyzed two years of video images before and after storms at Palm Beach,
Australia, and found that rip channels do not form in the exact same location
most of the time. Once the rip formed,
they could either remain fixed in location or migrate alongshore if the angle
wave of incidence was oblique. The results indicated that rip spacing does not
adjust to variation in offshore wave height, suggesting that rip currents may
be topographically controlled once they are formed.
Observations
indicate the rip currents can exhibit long period oscillations or pulsing (e.g.
Sonu, 1972; Bowman et al., 1988; Haller and Dalrymple, 1999 and others). These
oscillations generally have been attributed to modulations by surf beat of the
incident waves (wave groupiness). It has also been suggested that these
oscillations might arise from an instability of the longshore current (Smith and
Lagier, 1995) or the instability of the rip current flow itself, analogous to
instability of a plane jet (Haller and Dalymple, 2000).
Few
quantitative field measurements of rip currents are available. The lack of
quantitative measurements of rip currents is due to the difficulty of placing
instruments in the rip and that both rip currents and rip current morphology
often migrate. Several attempts during comprehensive field experiments (NSTS
Santa Barbara and Duck94) to measure rip currents with mobile current meter
systems were not successful. The lack of success is attributed to the rip
currents migrating (NSTS Santa Barbara), or the rip channel in the bar being
broad and not well defined (Duck94). The measurements that are available have
been more a result of opportunity in which the installed instruments
fortuitously end up in a rip current as the morphology evolved during the
experiment (Aagaard et al., 1997; Dette et al., 1995).
Direct field measurements of rip currents were obtained by tracking lagrangian floats photographed from tethered balloons (Sonu, 1972; Sasaki and Horikawa, 1975) at elevations of 120 m and up to 200m, respectively. Sonu (1972) describes the rips as having a narrow neck with an expanding head outside the surf zone. This observation corresponds to the argument by Authur (1962), using the theorem that potential vorticity must be conserved along a streamline, reasoned a rip current would tend to be narrower in shallow water and to expand as it moved into deep water. This implies the importance of including nonlinear terms in a hydrodynamic model describing rip currents. Another observation was that the current system was coupled to the bathymety with a stationary rip system. The deficiency of these measurements is the sampling time for current is short (order several minutes) owing to the limitation of the number of images that can be acquired using a film camera.
Sonu (1972) and Brander and
Short (2000) observed that rip current velocities intensify during low tides,
probably a result of the combined effects of more net water pumped over the bar
by wave mass transport and a smaller rip current channel cross-sectional area
More comprehensive measures
of rip currents were obtained by Smith and Largier (1995) using a sector-scanning
acoustic Doppler sonar mounted on the end of Scripps pier aimed in toward the
surf zone. The Doppler sonar provided
continuous estimates of radial velocities over a wedge with an arc of 45o
with a radius of 200 to 400 m with 3-4 m resolution and averaged over 30
seconds. The acoustic scatterers are
most likely bubbles injected though breaking processes, which limited the
measurements to the region outside the surf zone. Well-defined rip currents extending seaward from the surf zone
were observed. These rip currents occurred episodically, recurred aperiodically
approximately one to four times an hour. In this study, the rips recurred at a
preferred location, although it is not known whether this location was
controlled by bed morphology, the proximity of the pier, incident wave
patterns, or edge waves As the seaward flowing rip expanded laterally, a
mushroom-shaped structure (vortex pair) developed at the head. This vortex pair may detach from the stem of
the rip current and carry a patch of surf zone water offshore.
1.3 Hypotheses for generation of rip currents
The most generally accepted
hypotheses for the generation of rip currents require an alongshore variation
in the wave height. The alongshore
variation in wave height then generates variations in wave set-down outside the
surf zone and set-up inside the surf zone, with lower set-down and higher
set-up where the waves are larger and the opposite where the waves are lower.
These variations in mean sea level create quasi-steady pressure gradients to
drive rip current circulation cells.
Hypotheses for creating
alonghore variations in wave height are divided into mechanisms associated with
variations owing to wave-wave interactions and wave refraction over alongshore
variable bathymetry. Several wave-wave interaction mechanisms have been
suggested to create alongshore wave height variation even over planar
bathymtry. Dalrymple (1975) showed that incident waves crossing from opposite
quadrants generated alongshore variations in wave height. Bowen and Inman
(1978) demonstrated that subharmonic standing edgewaves of normally incident
waves generate stationary alongshore wave height variation. However, both these mechanisms result in
alongshore wave height variations with length scales generally much shorter
than the scale of observed holes in bars.
Symonds (2000) extended this idea to subharmonic standing edge waves of
normally incident surf beat to create stationary alongshore wave height
variations of much longer wavelengths.
It is generally accepted
that the most common reason for alongshore a variation in wave height is due to
wave refraction over alongshore inhomogeneous bathymetry. Holes in a nearshore
bar generate higher waves over the bar owing to convergence of wave rays due to
refraction, and lower waves over the holes due to the divergence of wave rays,
which then are responsible for rip currents.
Laboratory studies of nearshore bars with holes with fixed beds have
been conducted to study rip currents (Haller, et al., 1997; Svendsen and Hass,
2000). The laboratory measurements showed that there was significant shear over
the vertical in the rip currents. It was found that oblique wave incidence
damped rip current generation. Good comparisons of numerical models with the
laboratory studies have been obtained by Hass et al., 1998. However, the laboratory experiments and
numerical models have been limited to fixed morphology and monochromatic waves.
A question is what causes the bars
with holes in them in the first place? Mechanisms that generate these bed features
can be categorized as 1) bed forms as a direct response to alongshore
variability in the forcing, and 2) bed forms due to local feed-back mechanisms
between bed and flow (morphological instability). A number of linear instability
models have been proposed to examine length scales (Hino, 1975; Falques, et
al., 1996; Deigaard et al., 1999). These models use shallow water wave
equations (i.e., depth-averaged momentum and mass conservation equations),
along with a sediment conservation equation. The fastest growing modes of an
alongshore periodic bed perturbation is considered. Length scales are the same
order as observations. However, these model do not explain the mechanisms
causing the perturbation, and studies have been limited to linear instability
analysis and monochromatic waves.
Most recently, Reniers et
al. (2000) starting with a planar beach demonstrated that infragravity waves
generated by broad-banded waves (a directional spread JONSWAP spectrum)
combined with the sea-swell waves created nearshore bar morphology with holes,
which in turn generated rip currents.
This model is the basis of the modeling effort in this proposal and is
described below.
2. PROPOSED WORK
It is proposed to combine a
program of rip currents measurements in the field (section 2.1) with numerical
modeling (section 2.2) to comprehensively examine rip currents. The program is
designed to test a number of hypotheses based on past observations. The
proposal leverages on an existing ONR experiment measuring cross-shore
processes at a steep beach by expanding the area coverage to include
observations of a rip current system. The proposal is enhanced by collaborators
Tom Lippmann measuring surface currents using PIV from video images, Jamie
MacMahan measuring vertical velocity profiles of the rip current from a moving
water craft, and Graham Symonds providing rip current data for model
comparisons.
The experiment will be
performed on the relatively steep (high Irrabarren number), coarse sand beach
at Sand City, CA in 2001. The incident waves tend to be energetic,
narrow-banded and near-normally incident due to sheltering by headlands and
strong refraction over Monterey Canyon. The mean tide range is approximately 2
m. A directional wave buoy is located 10 Km offshore to measure incident waves.
Bathymetry is characterized by strongly perturbed, stationary, nearshore
crescentic bar system with well-defined rip channels (holes in the bar) with
spacing of approximately 100 m (Fig. 1). Owing to the near normal incident wave
field, the rip channels are stable over a period of months. This allows the placing of instrumentation
with a high probability of success in measuring the rip currents. A unique combination of Eularian and
Lagrangian measurement techniques will be utilized to ensure complete coverage
of the rip current system.
Hypotheses to
be tested by experiment and modeling:
1) It is hypothesized the regularity is associated with the band-width of the incident waves and slope of the beach. Observations find rip channels in nearshore bars can be either regularly spaced or irregularly spaced.
2) It is hypothesized the
spacing is a function of incident wave height, which in turn drives
infragravity waves. Alongshore spacing of rip channels are observed to vary
between beaches.
3) It is hypothesized the
intermittence is associated infragravity waves. Observations show strong
intermittence, or pulsing, of the rip currents.
4) It is hypothesized that
rip current strength is modulated by the tide owing to the modulation of the
breaking wave height by the varying depth of water. Rip current strength is
observed to vary with the tide.
Obviously the rip currents are minimal if the bar is exposed at low
tide. As the water level rises the rip
current intensity increases. But if the water level gets too high, the bottom
perturbation is no longer important and the rip current strength can
decrease. Therefore, the rip current
system is a complicated function of the tidal elevation.
5) It is hypothesized bottom
friction is important in shallow water to the rip current strength.
Considerable vertical shear in the rip jet was observed in the laboratory
measurements (Hass and Svendsen, 2000). The field measurements would provide
verification that the laboratory measurements are properly scaled owing to the
possible different roughness found in the lab and field.
2.1 FIELD EXPERIMENT
2.1.1 Rip Current Experiment, RIPEX: Work To Be Funded Under This
Proposal
A fundamental hypothesis is
that alongshore gradients of wave height are generated by refraction, shoaling
and reflection over the alongshore variable bathymetry that in turn creates
alongshore pressure gradients due to variable set-up/down to drive the rip
current system. It is proposed to
measure the wave, velocity and pressure fields spanning a bar and rip channel
system using a combination of in situ
current and pressure sensors (PUV), an in
situ alongshore lagged array of PUV to resolve infragravity waves, long
term video observations of the area, and rapid bathymetry and current profile
surveys (Figure 2).
Early in 2001, a remote
digital video camera system will be deployed overlooking the Sand City
observation site to establish the evolution rates of the barred system in
response to forcing measured by a Data Well directional wave buoy 10 Km
offshore. The system uses a 1024 by 760 pixel digital camera and imbedded
processing system to obtain high dynamic range 20 minute average, maximum and
minimum pixel value images which are stored locally and downloaded periodically
over an Ethernet link to the NPS campus. This data set will guide the
deployment of the 2001 field experiment and provide a long-term data set to
test subsequent
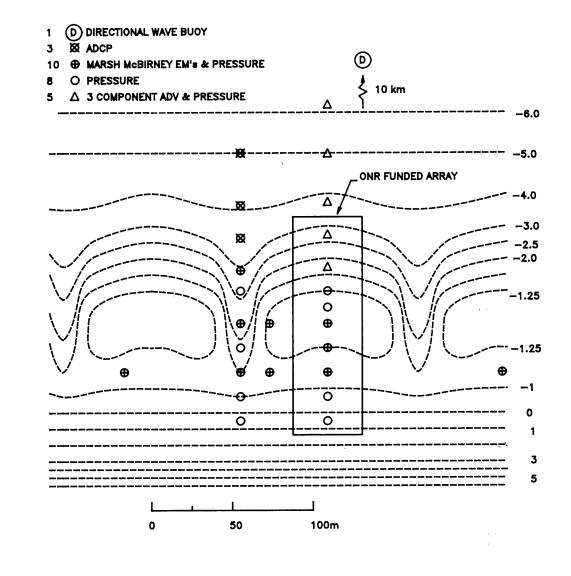
Figure 2. Plan view schematic of proposed array to
measure rip currents at Sand City, CA. The bathymetry is based on historical
profile data. The portion of the array
already funded by ONR is delineated.
modeling efforts. The instrumentation is a 'clone'
of a system in place at the Monterey Inner Shelf Observatory Site (Stanton
1999), so most of the programming and hardware design is borrowed from this
exiting system.
Waves and currents will be
measured in situ with the array shown
in Fig 2. The array is composed
pressure and current meters (PUV) configured in two cross-shore arrays and two
alongshore arrays. The objective of the
instruments are to measure the forcing of the rip current system (waves and
wave breaking, pressure gradients due to wave set up/down, mass transport of
the waves, and infragravity waves.) Ten
PUV instrument pods inside the surf zone consist of a Marsh McBurney em 2 axis
current sensors, a Hydrocon pressure sensor and a 16 bit isolated data
acquisition module. Electromagnetic (em) current meters are used inside the
surf zone as they perform well in the bubble laden water due to breaking waves.
Five three-velocity-component Acoustic Doppler Velocimeters (ADV's) along with
pressure sensors will be used outside the surf zone. The pressure and PUV arrays will be sampled synchronously
at 4 Hz, and logged directly into UNIX computers on shore. In addition to the
PUV sensors, vertical arrays of em's and conductivity, pressure sensor, wave
staff and acoustic instruments will measure the vertical profiles currents and
void fraction, waves and small scale morphology on top of the bar (see section
2.1.2 below) to measure breaking wave processes and the momentum and mass flux
into the rip current system.
The array
is filled out with 8 separate pressure sensors to measure pressure gradients.
Based on lab test and field measurements, the bed-mounted Hydrocon pressure
transducers resolve pressure differences down to 1cm, allowing the low
frequency pressure gradients forcing the dynamics of the rip system to be
determined.
Infragravity waves and
longshore current shear instabilities will be measured using a five-element PUV
alongshore array (Figure 2). The 234 m
array will effectively measure the low mode edge waves and shear waves on this
relatively steep beach (1:25 mean slope).
It is planned to augment the alongshore array with run-up measurements
(which cannot measure shear instabilities) using video techniques to obtain the
full edge wave spectrum.
The array
of instruments measuring rip currents flowing offshore consists of a
combination of PUV’s to measure the rip current in shallow water and feeder
currents, and 3 shallow water ADCP’s to measuring the vertical velocity structure of
the rip current flowing offshore. The ADCP’s will measure velocity profiles
with 0.25m vertical resolution across most of the water column, at a sample
rate of 1Hz. Even though the rip channels tend to be well defined, the rip
current jet is not stationary in its offshore flowing direction. Therefore, the
stationary measures of the rip current are augmented vertical velocity profiles
obtained by an ADCP mounted on a moving platform described next, and surface
currents obtained using PIV techniques video images from a video camera mounted
on a tethered balloon at an elevation of 75-150 m (section 2.1.2)
University of Florida Collaboration: Jamie MacMahan
The fixed instrument and PIV
velocity measurements of rip currents will be complimented by acquiring
velocity profiles using an instrumented jetski, or personal water craft (PWC)
(MacMahan, in press). This work will
be performed by Jamie MacMahan, PhD candidate under the direction of Bob Dean
at the University of Florida. Funds
have been requested for their participation and for the purchase of a motion
compensations system. The major components of the system are: (1) a 2000 3-man
Yamaha Venture 700 Wave Runner; (2) an Ashtech Z-Surveyor which samples 5 Hz;
(3) a single-frequency echosounder with a 208 kHz transducer; (4) a day light
readable screen; (5) a 17-button programmable Logic Controls keypad; (6) a
Pentium Toshiba Libretto 100 CT laptop computer; (7) Hypack surveying software
from Coastal Oceanographic, Inc; (8) RDI ADCP with high-resolution mode and
Windows software, and (9) KVH motion measuring system. The PWC with equipment
mounted on it is shown in Figure 3. The system has been used routinely (without
the ADCP) to obtain nearshore bathymetry for several years.
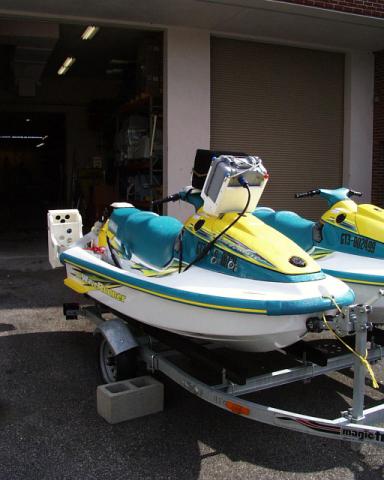
Figure 3.
Picture of Personal Water Craft (PWC) equipped with navigation,
echo-sounder and data acquisition system.
The instrumented PWC will
allow accurate and rapid documentation of the currents and bathymetry within
the rip currents. Bathymetry measurements acquired with similar systems (Cote,
1999; Dugan et al., 1999) compared
within 5 cm with bathymetry measured at Duck, N.C. with the CRAB (DGPS surveyed
large amphibious vehicle). During each day, an attempt will be made to conduct
a complete set of bathymetric and current measurements at four stages during a
tidal cycle. This will allow correlation of the volumes of water transported
over the bar by the waves with the cross-sectional area characteristics of the
rip channels.
The horizontal and vertical location of the
echo-sounder is measured with DPGS to within 5 cm at 5 Hz. The motion of the ADCP is compensated for
from the measurements of roll, pitch, heave and heading. However, within the
surf zone, it is prudent to have the breaking waves behind the vessel when
collecting data, allowing the vessel to travel quickly away from the face of
the breaking waves, rather than into. Furthermore, the operator is able to
collect data some distance behind the breaking waves/broken waves to reduce the
amount of data loss in the echo-sounder and the ADCP from sound attenuation by
bubbles generated from the breaking waves. The system will experience drop-outs
by bubbles within the wave-breaker region, and due to the fact that the waves
will be traveling faster than the maximum allowable surveying speed. Once the
water depths become too shallow (approximately less than 60 cm), data collection
is ceased and the PWC quickly moves out of the surf zone onto the next survey
line. The blanking distance of the ADCP is approximately 60 cm. Current
measurements are most favorable within in the vicinity of rip currents, due to
the reduction in wave heights by the wave-current interactions. This allows the
vessel to traverse either onshore or offshore. In addition, depending upon the
sea-state, the vessel may stop at various locations within the rip current for
longer sampling bursts.
2.1.2 ONR Funded Work for Steep Beach
Experiment
Work already funded is to
measure waves, velocities and sediments using a vertical and cross-shore arrays
and to measure surface velocities spanning the observation area using aerial
video PIV. The objectives of the vertical and cross-shore array are to measure
wave transformation and set-up/down, breaking wave and current-induced
turbulent bottom and surface boundary layers, and sediment flux in the surf
zone. A cross-shore array of 10
pressure sensors, 3 Sontec ADV Hydra systems (3 components of velocity, wave
amplitude and bottom elevation) and the BCDV2 will be deployed (Figure 3). In the ONR-funded field experiment
component, it is hypothesized that the plunging and collapsing/surging wave
breaking processes occurring on a steep beach are significantly different than
plunging/spilling breaking wave processes previously measured on near-planar,
moderately sloping beaches during NSTS and at Duck over a moderately sloping
bar. Wave reflection can be significant on steeper beaches, and it is
hypothesized that the breaking wave location is modified by reflected waves
owing to modulation of the water depth and the kinematics in the breaking
wave. The modulation of the breaker location
can then modify the dynamics of the nearshore.
A fixed central surf zone
array will be deployed (Figure 4), including vertical arrays of 8
electromagnetic current sensors and 12 conductivity cells, and a x-y
scanning altimeter, a co-located surface piercing wave staff and pressure
sensor, along with the new high resolution velocity, sediment and morphology
instruments. New instruments to be deployed to better resolve velocity and
sediment processes are a high resolution Bistatic Coherent Doppler Velocimeter
(BCDV2) (Stanton 1996), a scanning laser to measure sediment plumes in three
dimensions, and a very high resolution coherent side-scan sonar. The BCDV2 will
be able to measure three components of velocities and sediments at 20Hz every
0.6cm over the bottom 60cm. An existing scanned laser system will be upgraded
to form a remotely programmable, camera synchronized system to obtain high
resolution 3-D visualization of suspension events. The water clarity at the
proposed experimental site at Sand City will allow using optical techniques that
we have previously developed (and field-tested), but could not used at Duck
because of the highly turbid water. The
very high-resolution side-scan sonar uses coherent processing techniques to
distinguish bubbles and moveable sediments to resolve the fine scale bottom
structure with 0.5 cm horizontal resolution. These high-resolution velocity and
sediment boundary layer and morphology measurements should provide new insights
into sediment suspension and transport not previously observed, and to provide
a data-base to test models. The wave staff will improve our determination of
the free surface in measuring the void fraction, and, combined with a pressure
sensor directly beneath, provide better information on breaking wave processes. We will
take advantage of the 2m spring tide range by
installing the fixed array at spring low tide.
This results in the surf zone sweeping past the fixed measurement
location over a tidal cycle, so that the entire surf zone and swash is
measured. An additional advantage of a fixed array is that the temporal
evolution of the boundary layer processes and morphology will be obtained over
tidal cycles.
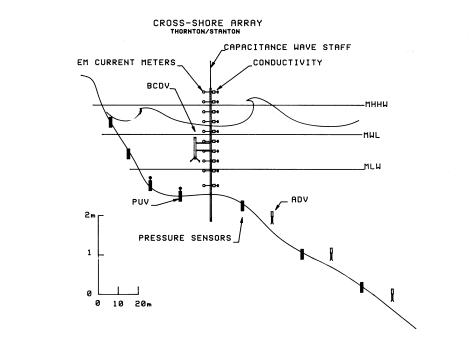
Figure 4.
Cross-shore array of instruments on steep beach (1:10) at Sand City, CA
scaled with a typical 14 second breaking wave.
The various tidal datums are shown.
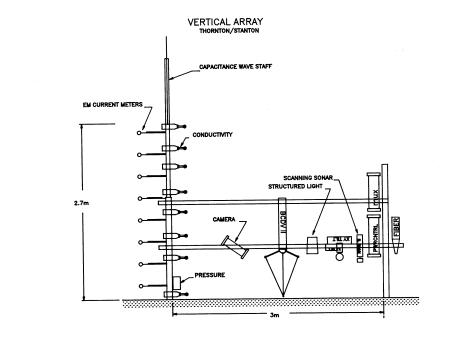
Figure 5.
Vertical array composed of 8 em current meters, 8 conductivity cells, a
capacitance wave staff, pressure sensor, structured light with video camera,
scanning x-y sonar and BCDV2.
Ohio State University Collaboration: Tom Lippmann
Surface velocity fields will be estimated from large-scale video particle-image-velocimetry (PIV) by Tom Lippmann (Ohio State University), who is collaborating in the experiment separately funded by ONR. Remote images are obtained by a motion compensated video camera mounted on a tethered balloon at an elevation of approximate 150 m. The balloon will be tethered such that the image is centered with in the surf zone. The images are acquired in real time using an RF telemetry link to the ground. After rectification of the images, correlation techniques between images will applied to track particle (e.g. foam, drifters, etc.) and calculate velocity fields. The present system is limited to day-light operation. Part of this proposal is to extend the measurements to night-time operation. Lippmann also be providing a jetski with DGPS navigation and an echo-sounder to provide bathymetric measurements.
2.1.4 NUMERICAL MODEL
The model the combines the
effects of short waves (sea-swell) and infragraivty waves (surf beat and edge
waves) on the nearshore morphological development. Surfbeat is defined as a
combination of free and bound infragravity waves generated by normally or
obliquely incident grouped short waves incident on a beach. Typical wave
periods associated with the infragravity waves are in the order of twenty
seconds to a number of minutes. The spatial scales associated with the
infragravity waves can be of the same order as the observed patterns present in
the bathymetry (O(50) m and larger (Holman and Bowen, 1982), hence their
potential importance in the near shore morphology.
The numerical model is an
extended research version of Delft3D (Reniers, et al., 2000). Delft3D is a
comprehensive numerical model, which includes a wave driver, hydrodynamic flow,
sediment transport, and morphologic response modules ( http://www.wldelft.nl/d3d/ ). Ad Reniers
is presently a National Research Council Post-doctoral fellow at the Naval
Postgraduate School under the direction of Prof. Thornton, and would be working
on this project. The extensions to Delft-3D include a more generalized wave
driver and different sediment transport modules. The wave driver input is a full 2-D energy density wave spectrum
in frequency and direction, E(f,h). The model considers Fourier pairs of
spectral components to generate infragravity waves through triad interaction
(described below). The wave components
are refracted shoreward. Diffraction and wave-current interaction are
neglected. Reflection is allowed at the shoreline. The infragravity waves are
solved in the time domain using a nonlinear longwave equation forced by the
radiation stresses of the short waves (Mei and Benmoussa, 1984) to phase
resolve bound and free infragravity waves, trapped (edge waves) and leaky
infragravity waves.
It is essential to phase
resolve the infragravity waves as the phase relationship between the short
waves (which act to stir the sediments into suspension) and the infragravity
waves depends on the mix of free and bound infragravity energy. For example,
the bound longwaves are 180 out-of-phase with the short wave groups travelling
with the group velocity. The orbital motion of the short waves stirs up the
sediment, which is then transported by the infragravity velocity. Given the
fact that groups of high waves that stir up more sediment, coincide with the
troughs of the infragravity waves, the predominant transport direction will be
offshore. Only close to the shoreline this direction is reversed as the higher
groups of short waves are propagating on top of the infragravity wave crests.
Within the surf zone the bound infragravity waves are released (the short waves
are dissipated due to breaking and the infragravity waves are no longer forced)
and return as a free waves.
The flow component solves
the slow-time evolution of time-averaged (over sea-swell periods) and depth
averaged Navier-Stokes equations. The
model equations include the fully nonlinear terms and uses eddy-viscosity to
describe turbulent momentum mixing. The
nonlinear bottom shear stress considers wave-current interaction (Soulsby,
1993). The module calculates the mean longhshore and cross-shore (undertow)
currents and the time variation allows for the generation of shear
instabilities of the longshore current. Curvilinear coordinates are used in the
calculations to more accurately represent the variable bathymetry.
The
sediment transport module includes transport by the mean currents and short and
infragravity waves. The short wave transport (stirring) is parameterized using
the short wave velocity moments generated locally using the nonlinear Fourier
representation of Fenton and Rienecker (1985), and calculates the
phase-resolved infragravity wave transport using the extended method of
Galapatti (1983). The sediment transport gradients are then integrated to
obtain temporal changes in morphology.
An example of model simulation of morphology and
currents is shown in Figure 7, which considers an infinite long beach. Qualitatively
realistic results are obtained. A Jonswap spectrum, E(f,h), with a root mean
square wave height of 1.0 m and a peak period of 10 seconds is used to
represent the short wave field. The mean short wave direction is shore normal
with a 35 deg spreading. The
wave-energy on the wave group scale is obtained from the Hilbert transform of
the surface elevation at the offshore boundary (using a single summation random
phase model). This wave energy is then propagated into the domain with a
refraction model. Wave energy dissipation due to wave breaking is taken into
account (Roelvink, 1993). The advection of the turbulent kinetic energy due to
wave breaking is described by a roller. The spatial variation of the wave
energy forces a bound long wave. The sediment is predominantly stirred by the
wave orbital motion with wave breaking turbulence added. Transport of sediment
is governed by the infragravity and mean velocities. The divergence of sediment
transport results in changes of the nearshore bathymetry (Figure 7). This is
all done within the same time-step (as opposed to the modular set-up commonly
used in Delft-3D). The updated bathymetry then affects the wave energy
propagation, and thereby the infragravity velocities and sediment concentration
and so on. The infragravity waves are reflected at the beach. At the offshore
boundary, a Riemann condition is used to allow the leaky infragravity waves
(generated in the surfzone) to leave
the domain. It is pointed out that the morphology response exhibits both forced
behavior (at the scales of the infragravity waves) and free behavior owing to
the local nonlinear feed-back between flow and morphology as described in
section 1.3. It is not necessary to
initialize the model with an alongshore perturbation, as the infragravity waves
force a plane the model to start changes in the morphology.
The calculated mean currents (averaged over the
sea-swell waves) are superposed on the morphology (Figure 6) showing rip
current development. The model was tested with 2-D bar formation in the
prototype wave tank at Delft using LIPP1D data, and compared qualitatively
well. A linear version of the wave driver was compared with DELILAH field data
acquired at Duck, NC, and edge waves variance and modal content were
quantitatively well predicted.
Objectives of the modeling research are first, to
assist in planning the rip current measurement array at Sand City based on
measured bathymetry. The model will
then be used to gain insight into the various hypotheses proposed in section by
performing model simultions for varying input parameters of wave energy,
band-width, directionality, and tidal elevation. Finally the model will be
compared with the measured rip currents and morphology for data all ready
acquired during RDEX at Palm Beach, Australia (see below) and for the proposed
experiment at Sand City assess and improve its predictive capability.
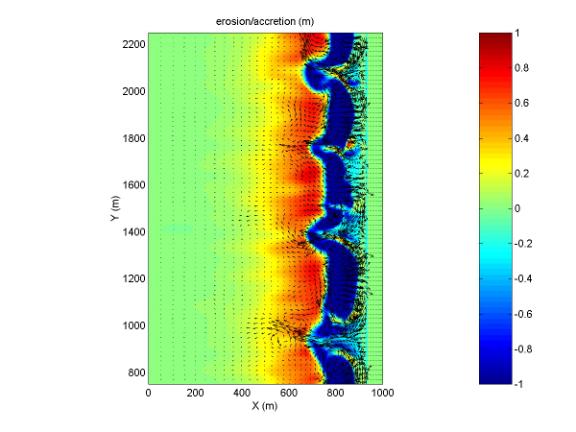
Figure
6. The bathymetric evolution (changes with respect to the initial plane sloping
beach) after approximately 12 days showing a barred beach (denoted by the dark
blue) intersected by irregularly spaced rip-channels. The average rip-spacing
is in the order of 250 m. A picture not
uncommon on many pocket beaches. The arrows are mean current (averaged over
sea-swell band) velocities showing rip currents.
Data for Model
Testing Collaboration with the University of New South Wales, Australia: Graham
Symonds
Observation of waves and currents in
arip channel were obtained during the Rip Dynamics Experiment (RDEX) on Palm
Beach, Sydney, Australia during the period October 10 to November 8, 1999. The prinicipal investigators of the
experiment were Graham Symonds and Andrew Short of the University of New South
Wales, Australia. The objectives of the experiment were to measure rip
magnitude as a function of the incident wave height and tidal elevation, and to
investigate rip pulsing at infragravity time scales. Palm Beach is a typical
pocket beach, 2.5 km long and is known as one of the more hazardous of Sydney’s
beaches because of strong, persistent rip currents. A permanent ARGUS video
imaging station is at this site. A rectified time exposure image of video
frames from this site with overlaid bathymetric contours taken at the beginning
of the field experiment is shown in Figure 7. Rip channels are clearly
identified by the 3 m contour, particularly on the northern and middle parts of
the beach. Rip channels are quite wide
(~100 m) and can be identified in the video time exposure. Deep water wave data were measured in 80 m
water depth approximately 20 km south of Palm Beach. Local wave data were measured at 10 m water depth offshore from
the current meters. Two S4 currrent meters were deployed at locations
shown. During the course of the
experiment more intensive measurements were also made over a tidal period by
deploying an array of Marsh McBirney em’s and ducted flow meters in the feeder
channel, while pressure transducers measured waves just outside the breaker
zone. Although these data are not as
comprehensive as the proposed experiment (e.g., a current meter and pressure
sensor were not collocated so that only mean wave direction can be calculated
and not a full directional wave spectrum), they will be used to test the model
and gain insight into rip current process in a pocket beach.
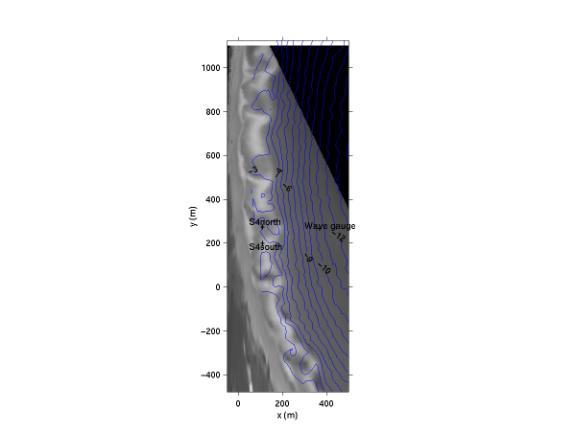
Figure 7. A rectified timelapse image of wave
breaking surface signatures at Palm Beach, near Syndey Australia. Bathymetry
contours have been superimposed, and the location of current and pressure
sensors are shown.