| home :|: contact |
Measurements
Typical examples of measurement data
|
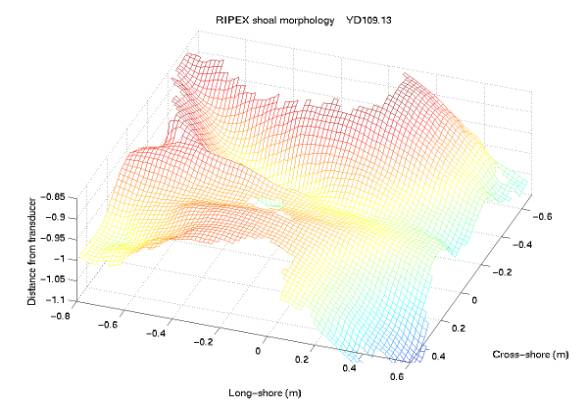
Figure 1: Detailed view of shoal morphology (located at red X on instrument plan view) showing mega-ripples. | |
|
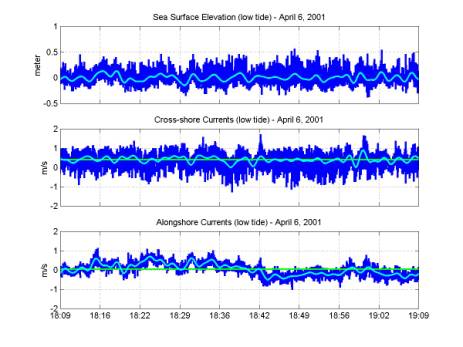
Figure 2: Surface elevation and depth averaged velocity components measured in the feeder current to the rip. Sample rate is 1 Hz. The low-pass signal is indicated, showing considerable variation and pulsing over the one-hour record. |
| home :|: contact |