The GUI capabilities:
- easy access to the RAFOS database;
- visualization of either all available, or an acquired subset of, RAFOS trajectories;
- the ability to track float movement and retrieve the associated pressure and temperature information;
- computation of Eulerian statistics (mean velocity and variance ellipse) for a cluster of trajectories within a customized rectangular region.
It is possible to run the GUI in MATLAB or as a stand-alone application outside of MATLAB.
Download, Unpack and Run the GUI offline.
|
If you have MATLAB installed on your computer, you can run the GUI in MATLAB using RAFOSgui source code (created in MATLAB 6.5), given immediately below |
PC WINDOWS users can run the GUI even they do not have MATLAB installed on their computers using MATLAB stand-alone application for WINDOWS, given immediately below |
|
File size: 20.6 MB (21,663,744 bytes)
5 files in the archive / total length 73.3 MB
It is necessary to have permission to write files to the current MATLAB directory
(in which you put the RAFOSgui source code).
|
File size: 31.0 MB (32,550,912 bytes) 316 files in the archive / total length 94 MB |

Problems? Tell us, please
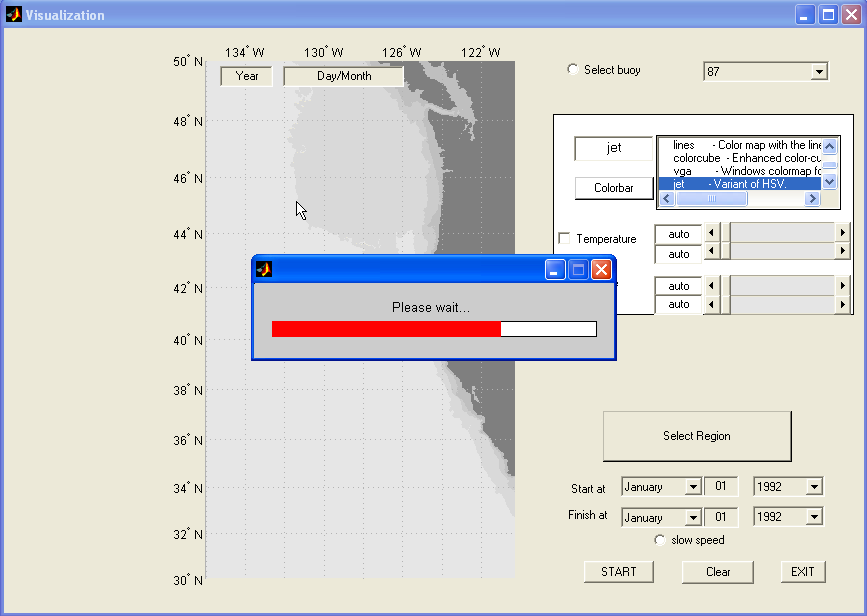
The process of data loading takes no more than 30 s for a Pentium 4 CPU, during which time the GUI is non-interactive.
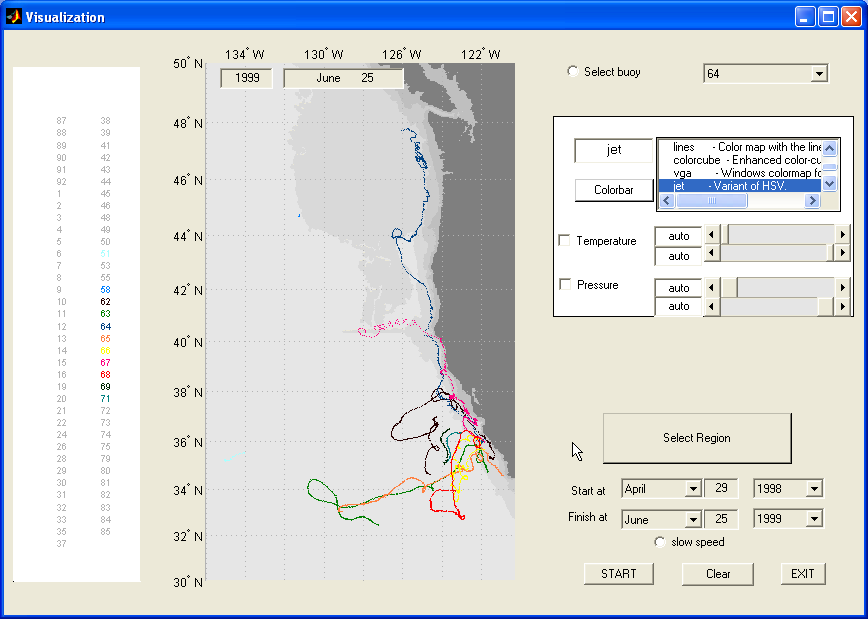
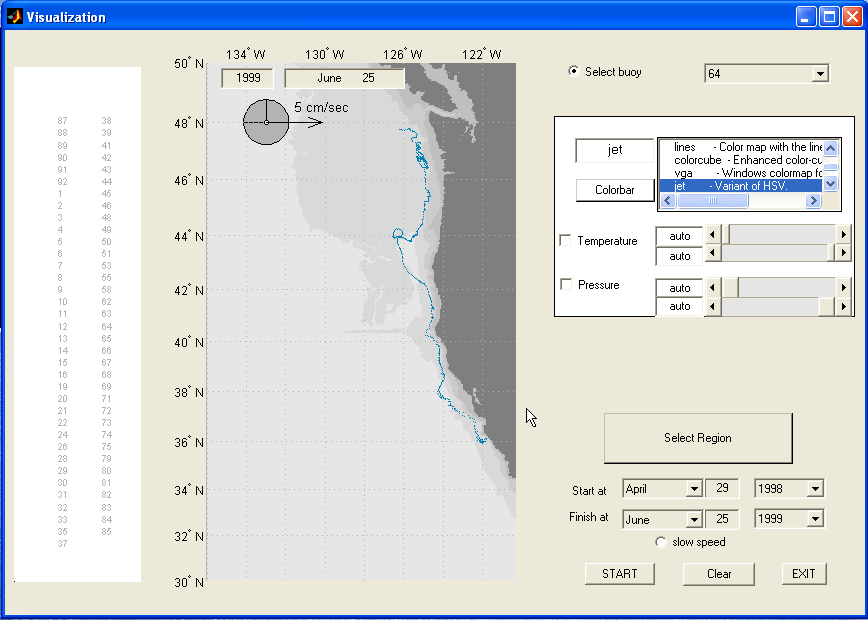
Two main modes are possible using this GUI:
|
1) visualization of a single float trajectory; |
2) drawing of all or parts of trajectories during
some pre-defined time period |
|
|
 |
|
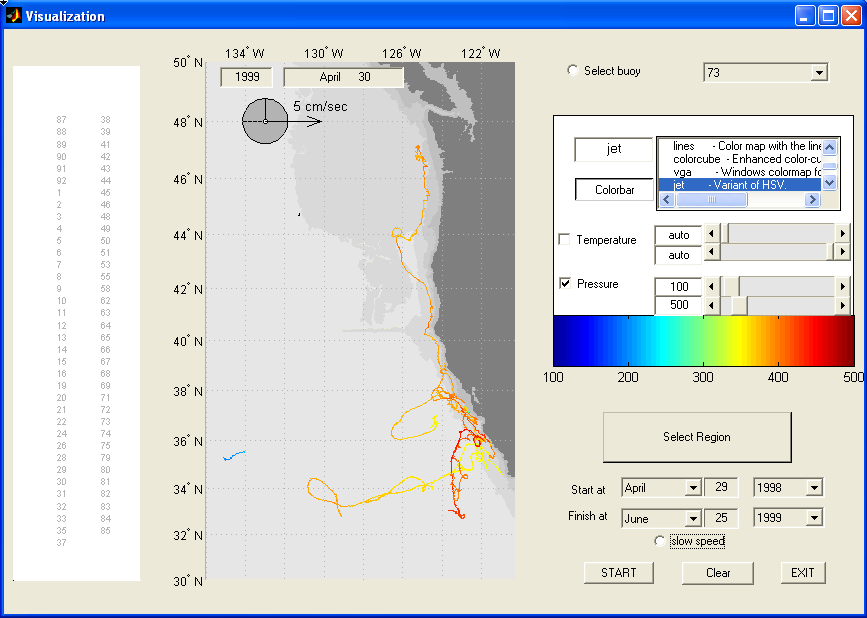
Visualization of pressure and temperature along float trajectories is available for both single and group modes: |
|
 |
|
|
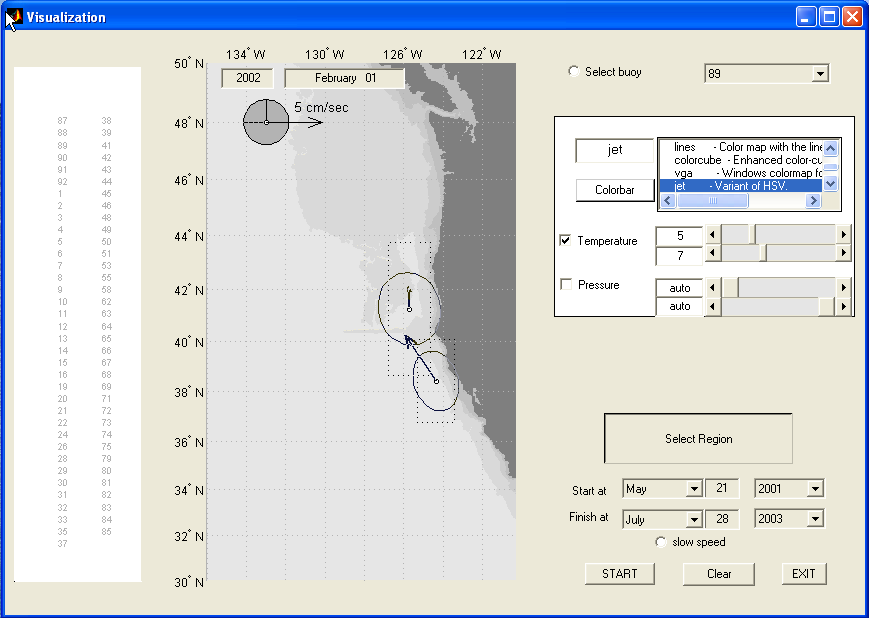
The last diagram demonstrates the process of calculating and visualizing mean velocities and ellipses of variance (Freeland et al., 1975; Davis, 1991). All the trajectory fragments in a chosen region over a time instant use one-day time-steps. Because of the "accumulating" nature of this process, the beginning visualization should be considered as very approximate due to low statistical significance. |
|

Freeland, H.J., Rhines P.B., Rossby T., 1975: Statistical observations of the trajetories of neutrally buoyant floats in the North Atlantic,
![]() Journal of Marine Research, 33, 383-404.
Journal of Marine Research, 33, 383-404.
Davis, R.E., 1991: Observing the general circulation with floats, Deep-Sea Research, 38, Suppl. 1, S531-S571.